
Taking profits with a ladder, often called DCA out in crypto, means selling a position in instalments, either on set dates or at set prices, instead of selling all of it at once. The name reverses DCA (dollar cost averaging: buying a fixed amount at regular intervals). Instead of gradual buying, it is gradual selling.
The problem it tries to solve is old and hard. The top of a market can only be recognised after it has passed. Whoever sells everything early watches the price keep rising without them. Whoever waits can see much of the value disappear within a few months. Selling in instalments does not solve this dilemma. It spreads it across many smaller decisions.
This article explains where the idea comes from and tells a documented episode from 1720. It shows how the strategy works with a hypothetical example and with two series of our own simulations on Bitcoin. It also sets out what the strategy costs, how exit plans have failed in practice, and which questions remain open.
This article is for information only and is not investment advice. It does not tell anyone whether to use the strategy. Every example and simulation in it describes the past.
The top is only visible in hindsight
Take Bitcoin, the cryptocurrency with the longest reliable price history. On 16 December 2017 its closing price was $19,641. On 15 December 2018 it was $3,185, which is 83.8% lower [1]. On 8 November 2021 it closed at $67,542, and on 9 November 2022 at $15,758, a fall of 76.7%. On 6 October 2025 it closed at $124,824, and the lowest close over the following six months was $63,495, a fall of 49.1% [1]. Every percentage here is our calculation: the low close divided by the high close, minus one.
None of these highs was known to be the top on the day it happened. That is the problem every exit plan has to deal with. A Morningstar article puts it simply: whoever sells the whole position now risks missing any gains that come later, and whoever waits to sell later risks seeing the position lose value [2].
The two wrong outcomes do not hurt everyone equally. Some people fear most the big fall that follows a missed chance to sell. Others fear most the continued rise after a hasty sale. Both come with regret.
There is a second dimension. After a large rise, a single asset can make up a much bigger part of a portfolio (all of a person's investments) than its owner originally planned. The question is then not only "when" but also "how much, and how fast".
Where the idea came from
Selling in instalments is far older than cryptocurrencies. The next section presents a 1720 account book that records such sales. The theoretical debate, however, started from the opposite side: buying.
In 1979 the economist George Constantinides published "A Note on the Suboptimality of Dollar-Cost Averaging as an Investment Policy" in the Journal of Financial and Quantitative Analysis. He showed in theory that a pre-set buying schedule is inferior to a policy that uses information as it becomes available [3][4]. The paper concerns traditional markets. That the same logic applies to a pre-set selling schedule is our reading, not a claim made by the paper.
In 2000 Robert Almgren and Neil Chriss published "Optimal execution of portfolio transactions" in the Journal of Risk [5]. The paper treats the liquidation of a large position as a trade-off between two costs. The first is the cost of the sale itself moving the price, when someone sells too fast. The second is the risk (the possibility of an adverse outcome) from volatility (price swings), when someone sells too slowly. This is the professional root of splitting a large sale over time, in traditional markets and for large orders.
In 2012 Vanguard examined the markets of the United States, the United Kingdom and Australia in its report "Dollar-cost averaging just means taking risk later". It found that a lump sum investment (investing the whole amount at once) returned more than gradual buying in about two-thirds of cases [6]. The study concerns buying, not selling, and traditional assets.
In 2013 Adam Zoll of Morningstar gave the reverse pattern a name: "reverse pound-cost averaging" [2]. He explained that whoever sells equal money amounts at regular intervals sells more shares when prices are low and fewer when they are high, the opposite of what a seller wants. According to Zoll, the only advantage of gradual buying that survives the reversal is a disciplined framework that removes the temptation to time the market [2].
In crypto, the terms "DCA out" and "take-profit ladder" circulate in forums and blogs. We found no documented first use, so their origin remains unknown. What is documented is that exchange automation was designed mainly for buying. On Kraken, for example, recurring orders (orders that execute automatically at a fixed frequency) buy crypto on a daily, weekly, biweekly or monthly schedule. According to the platform, they are not available on Kraken Pro [7]. Where no equivalent selling feature exists, the strategy is carried out with ordinary sell orders.
1720: Thomas Guy, Isaac Newton and the South Sea Company
The South Sea Company was founded in 1711, primarily as a scheme for managing British government debt. In 1720 the government announced that the company would take over most of the national debt. Its stock then went through one of the most famous rises and falls in financial history [8]. The price climbed all summer, collapsed in September, and by October the stock was worth less than a quarter of its peak [8].
Isaac Newton, then master of the Royal Mint, was a long-standing shareholder. The mathematician Andrew Odlyzko reconstructed his moves from documents, many of them in the archives of the Bank of England. Shortly before the bubble, Newton's fortune was just over £30,000 [8]. According to Odlyzko's analysis, Newton liquidated his entire stake within less than a week, on 19 and 23 April 1720. The two dates bracket a shareholders' meeting on 21 April [8]. In mid-June he bought back in, "almost at the peak" in Odlyzko's words, and by September nearly his whole fortune was in the company's stock. By mid-1721 his fortune had fallen to about £20,000 [8].
Thomas Guy took a different path. According to Odlyzko, he began liquidating his stake the day after the meeting, kept his profits and used them to found Guy's Hospital [8]. The account book in which Guy himself recorded his sales was published in 1938 in The Baptist Quarterly by T. Roy Jones [9].
The book shows that Guy held stock with a nominal value of £54,040. He began selling on 22 April 1720 at 340% of nominal value [9]. By mid-June he had made 48 separate sales (our count from the ledger), most of them for £1,000 of nominal value. Prices broadly rose: 351%, 353%, 360%, 382%, 410%, 450%, 522%, 545%. On 10 June he sold stock with a nominal value of £4,000 at 600%. His last sale, of only £40 nominal value, was on 14 June at 525% [9]. In total he received £232,591 12s, which he invested in 4% and 5% government annuities and in "India Stock" [9].
Jones thereby corrected the earlier version in the Dictionary of National Biography. That version spoke of £45,500 and of sales that began at £300 and ended at £600 per share [9]. According to Jones, the peak came on 26 June, twelve days after Guy's last sale, when a £100 share was worth £1,060. On 21 September the same share could be bought for £150 [9].
A simple calculation (our calculation) gives Guy an average sale price of 232,591.6 ÷ 54,040 × 100 = 430.4% of nominal value. That is about 40.6% of the peak Jones reports.
That is what the documents show. What follows is our reading.
Guy recorded no rule. The book shows behaviour, not a strategy in today's sense. But the behaviour looks very much like a ladder: small, frequent pieces, at rising prices, until nothing was left. Guy did not catch the top, since his average price was less than half of it. He did, however, sell his whole position before the collapse.
Newton got out early and all at once. The documents do not say why he went back in, and Odlyzko notes that there is no direct evidence of his motives [8]. His example still shows something that holds today: an exit plan says nothing about re-entry. And the detail usually forgotten in Guy's story is the last one: what he did with the money after selling.

How it works, from zero
Imagine a grower who has gathered the whole harvest and has to sell it at the weekly market. If the grower brings everything on the same day, the price received depends entirely on that day. If the grower brings a part each week, they receive the average of many days. They will not get the dearest day, but they will not get the cheapest either.
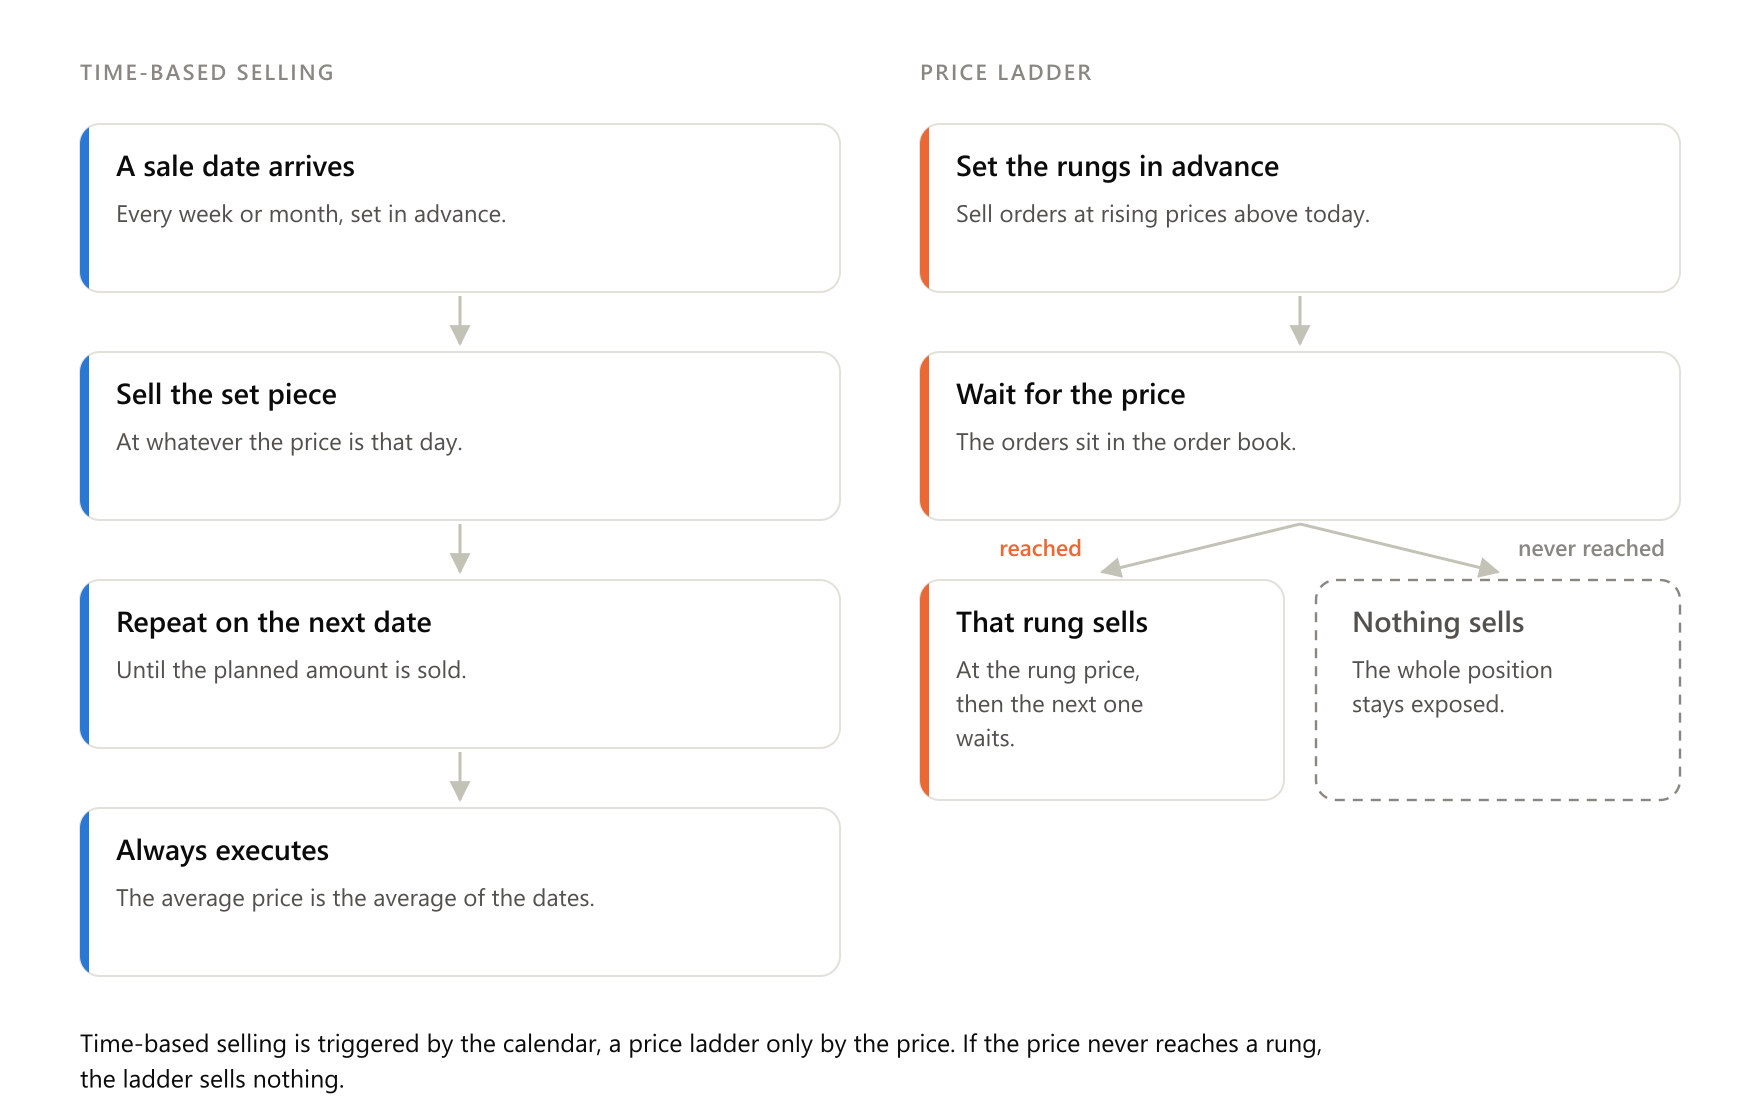
Taking profits with a ladder does the same with a crypto position. It has two basic forms.
In the time-based form, the sale happens on set dates, say every week or every month, whatever the price. The grower goes to market every Saturday, come rain or shine.
In the price ladder form, the owner sets price levels in advance, the "rungs", and sells a piece only when the price reaches each one. The grower brings a crate only when the market price passes an amount decided beforehand.
One detail changes the outcome a great deal: what stays fixed in each sale. If the quantity stays fixed (for example 0.1 BTC each time), the average sale price equals the arithmetic mean of the prices, which is their sum divided by their number.
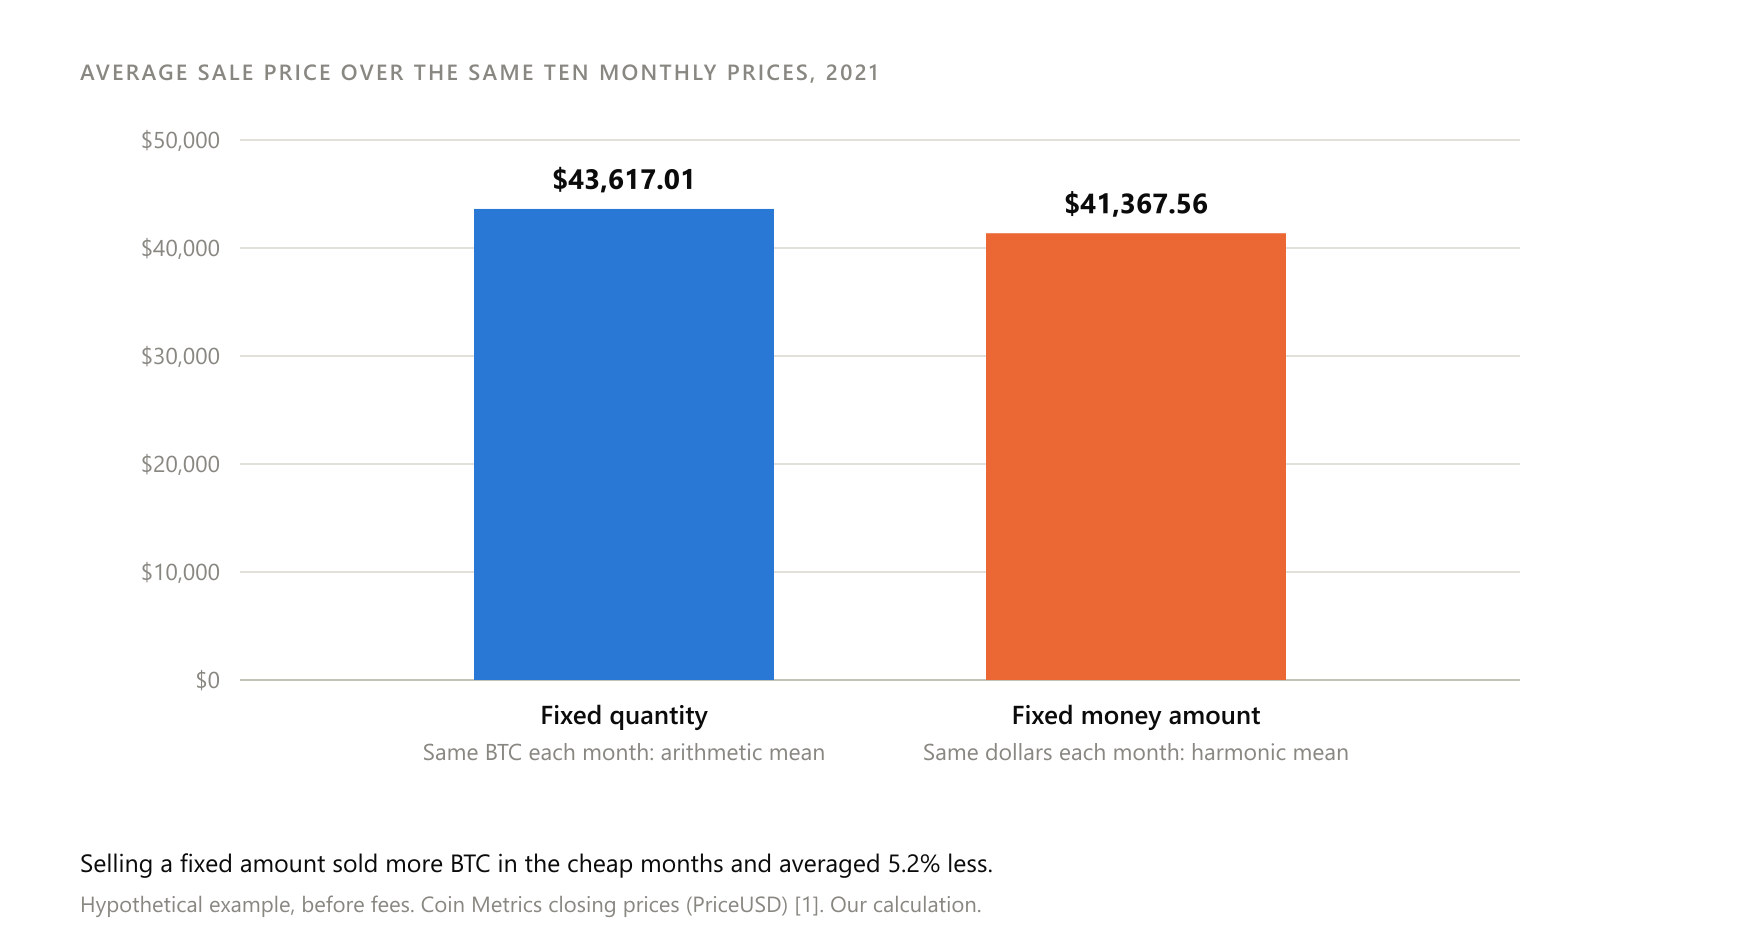
If the money amount stays fixed (for example $1,000 each time), then when the price is low more units have to be sold to make up the amount. The average sale price then becomes the harmonic mean of the prices, which is always lower than or equal to the arithmetic mean. This is exactly what Zoll described: in reverse, the "advantage" of fixed amounts works against the seller [2]. In section 14 we put a number on it with real prices.
The market analogy stops working in three places. First, the price of a harvest does not double, or lose three-quarters of its value, within a few months, whereas Bitcoin's price has done so repeatedly [1]. Second, a market rarely closes without warning, whereas an exchange can halt withdrawals, as section 13 shows. Third, the grower is paid in cash, whereas the proceeds of a crypto sale often end up in a stablecoin (a cryptocurrency that aims to hold a fixed exchange rate with a currency, usually the dollar), which can temporarily lose its peg.
Hypothetical example: ten sales during 2021
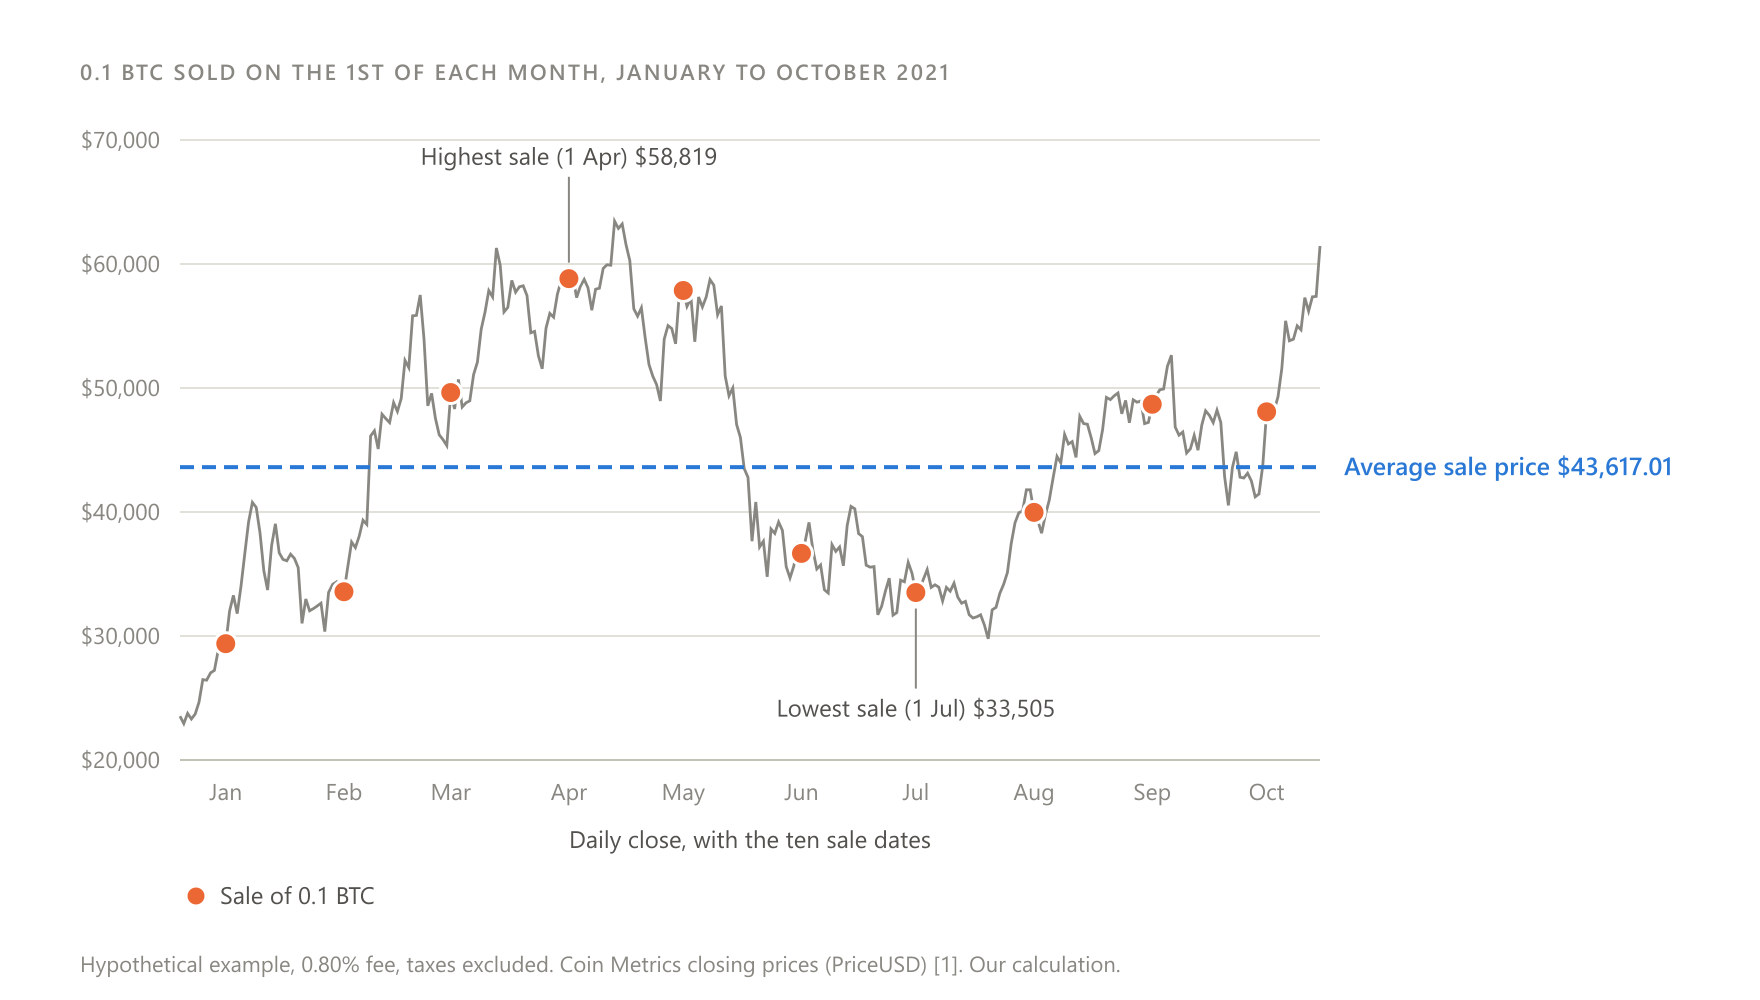
Hypothetical example. An investor holds 1 BTC and decides to sell 0.1 BTC on the 1st of each month from January to October 2021, which is ten sales. Prices are Coin Metrics closing prices (the PriceUSD series), defined as the price at the end of the day in UTC time, in US dollars [1][10]. Each sale pays a trading fee of 0.80%, the taker fee of Kraken Pro's first tier on 9 October 2026 [11]. Taxes are ignored. Bitcoin and the amounts are illustrative and are not a recommendation.
On 1 January 2021 the investor sells 0.1 BTC at $29,380.69, pays a $23.50 fee and is left with 0.9 BTC. A month later they sell another 0.1 at $33,570.27, and the average sale price rises to $31,475.48.
In March and April the price surges. The sale on 1 April happens at $58,818.98, the highest price in the plan. In June and July the price falls to $36,661.38 and $33,505.08, and the rule keeps selling as normal, pulling the average down. The tenth sale, on 1 October, happens at $48,078.13 and uses up the position.
| Date | Close (USD) | Sold (BTC) | Gross (USD) | Fee (USD) | Remaining (BTC) | Cumulative net (USD) | Average sale price (USD) |
|---|---|---|---|---|---|---|---|
| 1 January 2021 | 29,380.69 | 0.1 | 2,938.07 | 23.50 | 0.9 | 2,914.56 | 29,380.69 |
| 1 February 2021 | 33,570.27 | 0.1 | 3,357.03 | 26.86 | 0.8 | 6,244.74 | 31,475.48 |
| 1 March 2021 | 49,634.45 | 0.1 | 4,963.44 | 39.71 | 0.7 | 11,168.47 | 37,528.47 |
| 1 April 2021 | 58,818.98 | 0.1 | 5,881.90 | 47.06 | 0.6 | 17,003.32 | 42,851.10 |
| 1 May 2021 | 57,863.59 | 0.1 | 5,786.36 | 46.29 | 0.5 | 22,743.38 | 45,853.60 |
| 1 June 2021 | 36,661.38 | 0.1 | 3,666.14 | 29.33 | 0.4 | 26,380.19 | 44,321.56 |
| 1 July 2021 | 33,505.08 | 0.1 | 3,350.51 | 26.80 | 0.3 | 29,703.90 | 42,776.35 |
| 1 August 2021 | 39,968.97 | 0.1 | 3,996.90 | 31.98 | 0.2 | 33,668.82 | 42,425.43 |
| 1 September 2021 | 48,688.54 | 0.1 | 4,868.85 | 38.95 | 0.1 | 38,498.72 | 43,121.33 |
| 1 October 2021 | 48,078.13 | 0.1 | 4,807.81 | 38.46 | 0.0 | 43,268.07 | 43,617.01 |
At the end of the plan the average sale price was $43,617.01. Fees came to $348.94 and net proceeds to $43,268.07 (our calculation).
For comparison, a lump-sum sale of the whole BTC on 1 January 2021 would have netted $29,145.65. Holding and selling the whole BTC on 1 October 2021 would have netted $47,693.51 (our calculation). The highest close of 2021, $67,542 on 8 November, came after the plan had ended [1].
These results describe a past period and do not show what will happen in the future.
The rules that define it
Taking profits with a ladder is not one rule but a family of rules. Each version is defined by a few parameters.
The first is the trigger: a date or a price. In the time-based form the sale executes in every case. In the price ladder it may never execute.
The second is the unit of each sale: a fixed quantity, a fixed money amount, or a percentage of what remains. As we saw, the choice changes the average sale price.
The third is the number and duration of the sales, or for a price ladder the spacing of the rungs. Ten monthly sales spread the exit over almost a year, while twenty-six weekly sales spread it over six months. Rungs every 25% above a reference price fill quickly in a strong rise, while rungs every 100% may never fill.
The fourth is the reference price for the ladder: the purchase price, the price on the day the plan is drawn up, or some earlier high. The fifth is the order type, which the next section covers in detail.
The sixth is where the proceeds go: a bank account, a stablecoin, or a balance left on the exchange. The seventh is whether there will be a core of the position that is never sold.
The strategy also leaves things open. It does not say what happens if the price never reaches the rungs, whether and when to buy back, when the plan begins, or where and how the proceeds are kept. In 1720, Newton fell into exactly one of these gaps.
How it is executed and what it cannot protect against
The orders and where they sit
A sale on an exchange is usually made with one of two order types. A market order (an order executed at the best price available at that moment) executes immediately, whatever the price. A limit order (an order with a price limit) sets the minimum price at which the owner is willing to sell. That order waits in the order book (the exchange's list of open orders) until a buyer is found at that price or higher.
On Kraken, the fee is charged when the order executes, and orders cancelled before execution are not charged [12]. An order that waits in the book pays the lower maker fee (for the side that "makes" an offer). An order that executes immediately pays the higher taker fee (for the side that "takes" an existing offer). On 9 October 2026, in Kraken Pro's first tier, the fees were 0.40% and 0.80% respectively [11].
This creates a practical difference between the two forms of the strategy. A price ladder is in essence a series of limit orders at rising prices, placed in advance. A time-based sale needs an order on each date. Where the platform offers no automation for selling, as with Kraken's recurring orders, which cover only buying [7], the owner places each order themselves.
In both cases, the crypto waiting to be sold sits on the exchange. So do the proceeds, unless they are moved elsewhere. These assets are in the platform's custody, and the owner takes on counterparty risk: the risk that the platform cannot return what it owes.
Execution in fast markets
On 21 June 2017, at 12:30 Pacific time, someone placed a market order on the GDAX exchange to sell ETH worth many millions of dollars [14]. According to the company's statement, the order filled at prices from $317.81 down to $224.48, a fall of 29.4% [13]. That is slippage (the gap between the expected price and the execution price).
The fall triggered about 800 stop-loss orders (orders that sell automatically below a set price). It also triggered liquidations, meaning forced sales of positions opened with leverage (borrowed funds). ETH briefly traded at $0.10 [13]. GDAX did not reverse the trades, but it credited customers whose stop-loss orders or leveraged positions were executed because of the sudden move [14].
The episode shows in practice what Almgren and Chriss described in theory [5]: one large sale at once can itself move the price against the seller. That is one reason large sales are split up.
On 10 October 2025 a sharp market fall led to liquidations of leveraged positions worth at least $20bn [15]. Binance said it paid $283m in compensation to users affected by the loss of the peg of USDe, BNSOL and WBETH on its platform [15].
A ladder of limit orders above the current price does not execute in a fall like this. It does not harm the owner in the crash, but it does not protect them from it either.
Sizing arithmetic
Hypothetical example with illustrative numbers (our calculation). Someone holds a position worth P and splits it into five rungs of 20%, the first at +25%. If the first rung executes, they receive 0.2 × 1.25 = 0.25 P gross. If the price then falls to half its starting level, their total value is 0.25 + 0.8 × 0.5 = 0.65 P. Had they sold nothing, it would be 0.50 P.
If instead the price falls to half without ever touching +25%, the value is 0.50 P under both plans. The size of each rung determines how much value each execution "locks in". The position of the first rung determines whether anything gets locked in at all.
What the rule cannot cover
No selling rule protects against the insolvency of the platform where the funds sit. When FTX halted all crypto withdrawals on 8 November 2022, anyone who had already sold and was holding the proceeds there in crypto assets could not withdraw them [16].
Nor does it protect against a loss of peg in the asset that receives the proceeds. In March 2023 USDC fell as low as $0.88 [17]. Finally, it does not protect against a fall that starts before the first rung, as our second simulation in section 10 shows.
Our view at CRYPTONEA 24 is that the least discussed part of any exit plan is where the proceeds go. A sale is only truly complete when the money sits where the owner has decided it should be.
The versions people use
| Version | How it works | What it changes in the outcome |
|---|---|---|
| Time-based, fixed quantity | Same quantity on each date | Average sale price equals the arithmetic mean of the prices |
| Time-based, fixed money amount | Same amount in dollars or euros on each date | Sells more units at low prices, with the harmonic mean as the average price [2] |
| Percentage of what remains | E.g. 10% of the remainder each time | The position keeps shrinking but never reaches zero |
| Price ladder | Limit orders at set rising prices | Sells only in a rise and may never sell |
| Ladder with a core | Ladder for one part, the rest is never sold | Price exposure remains as long as the core is held |
Compared with the alternatives
| Approach | What it does | What it gains | What it gives up |
|---|---|---|---|
| Lump-sum sale | Sells the whole position at once | Done immediately, one fee | Any later rise |
| Holding with no exit plan | Does not sell | Any later rise | No protection from any fall |
| Time-based ladder | Sells on dates | An average price, less regret in either direction | Neither the highest nor the lowest outcome, more fees |
| Price ladder | Sells at set prices | Sells only in a rise | May not execute, or may execute entirely too early |
| Rebalancing to a target allocation | Sells when the share exceeds a target | The sale is tied to the whole portfolio [2] | Needs a pre-set target allocation |
| Stop-loss or trailing stop | Sells when the price falls below a limit | Limits losses | Executes in a fall, with slippage risk [13] |
Rebalancing (restoring a portfolio's weights to a set allocation) and stop-losses are separate strategies with their own articles in the Crypto 101 series. They appear here only for comparison.
What the evidence says
The research
The studies relevant to this topic fall into two groups: those on traditional markets and those on crypto. Results from traditional markets do not carry over to crypto automatically.
| Study | Year, venue | Market | Finding, in the data studied | Crypto |
|---|---|---|---|---|
| Constantinides [3][4] | 1979, Journal of Financial and Quantitative Analysis | Theory | A pre-set buying schedule is inferior to a policy that uses new information | No |
| Almgren and Chriss [5] | 2000, Journal of Risk | Theory | Liquidating a large position as a trade-off between price impact and volatility risk | No |
| Vanguard [6] | 2012, report | United States, United Kingdom, Australia | Lump-sum investing returned more in about two-thirds of cases (buying, not selling) | No |
| Zoll, Morningstar [2] | 2013, article | General | Selling fixed amounts sells more units at low prices | No |
| Shefrin and Statman [18][19] | 1985, Journal of Finance | Trades by individual investors | Tendency to sell winning positions early and hold losing ones | No |
| Odean [20] | 1998, Journal of Finance | 10,000 accounts at a large brokerage | Strong preference for selling winners, not justified by later performance | No |
| Schatzmann and Haslhofer [21] | 2023, Digital Finance | Bitcoin, transfers to exchanges | The same tendency, with varying intensity, more marked from 2017 | Yes |
We found no published study that directly tests taking profits with a ladder or price ladders in crypto. So we ran two series of our own simulations.
First simulation: time-based selling
Hypothetical example, backtest (a simulation of a rule on historical data). The rule is as follows:
Position and sales: a starting position of 1 BTC, illustrative. Each week 1/26 or 1/52 of the BTC is sold at the closing price. The first sale happens on the start date, so each start has two end dates: 25 and 51 weeks later.
Prices and costs: Coin Metrics prices, PriceUSD series, end-of-day close in UTC time, nominal prices in US dollars [1][10]. The fee is 0.80% per sale (taker, Kraken Pro first tier on 9 October 2026) [11]. Taxes are ignored.
Comparisons: a lump-sum sale of the whole BTC on the start date, and holding then selling the whole BTC on the date of the last weekly sale. Both pay the same fee.
Measures: drawdown (the fall in value from its previous high) is calculated on the value of cash plus remaining BTC at each daily close. "Days below" is the longest continuous period in which that value was lower than the net proceeds of a lump-sum sale on the first day.
We do not give CAGR (compound annual growth rate), because no window exceeds 357 days. The start dates include three peaks, two troughs and one start a year before a peak. There is no 52-week plan from the October 2025 peak, because the price series runs to 23 May 2026.
| Start | Sales | Start price (USD) | Lump-sum sale, net (USD) | Ladder, net (return) | Average sale price (USD) | Hold and sell at end (return) |
|---|---|---|---|---|---|---|
| 16 December 2017 (peak) | 26 | 19,641 | 19,483 | 10,191 (−48.1%) | 10,274 | 7,496 (−61.8%) |
| 16 December 2017 (peak) | 52 | 19,641 | 19,483 | 8,194 (−58.3%) | 8,260 | 3,381 (−82.8%) |
| 15 December 2018 (trough) | 26 | 3,185 | 3,160 | 4,798 (+50.6%) | 4,836 | 7,876 (+147.3%) |
| 15 December 2018 (trough) | 52 | 3,185 | 3,160 | 7,132 (+123.9%) | 7,189 | 7,452 (+134.0%) |
| 8 November 2020 (one year before a peak) | 26 | 15,500 | 15,376 | 39,091 (+152.2%) | 39,407 | 56,120 (+262.1%) |
| 8 November 2020 (one year before a peak) | 52 | 15,500 | 15,376 | 41,679 (+168.9%) | 42,015 | 60,942 (+293.2%) |
| 8 November 2021 (peak) | 26 | 67,542 | 67,001 | 45,221 (−33.1%) | 45,586 | 38,258 (−43.4%) |
| 8 November 2021 (peak) | 52 | 67,542 | 67,001 | 33,905 (−49.8%) | 34,179 | 20,327 (−69.9%) |
| 9 November 2022 (trough) | 26 | 15,758 | 15,632 | 22,037 (+39.8%) | 22,215 | 28,813 (+82.8%) |
| 9 November 2022 (trough) | 52 | 15,758 | 15,632 | 25,135 (+59.5%) | 25,337 | 35,149 (+123.1%) |
| 6 October 2025 (peak) | 26 | 124,824 | 123,826 | 87,555 (−29.9%) | 88,261 | 66,118 (−47.0%) |
The return on the lump-sum sale is −0.8% in every window, equal to the fee. From the start date that amount sits in cash, so it has no drawdown and no days below. The second table shows the path to the end for the other two approaches.
| Start | Sales | Ladder: maximum drawdown | Ladder: days below | Hold: maximum drawdown | Hold: days below |
|---|---|---|---|---|---|
| 16 December 2017 | 26 | −54.1% | 175 | −66.3% | 175 |
| 16 December 2017 | 52 | −59.6% | 357 | −82.8% | 357 |
| 15 December 2018 | 26 | −14.8% | 0 | −17.4% | 0 |
| 15 December 2018 | 52 | −19.3% | 0 | −46.0% | 0 |
| 8 November 2020 | 26 | −18.4% | 2 | −25.6% | 2 |
| 8 November 2020 | 52 | −30.3% | 2 | −53.1% | 2 |
| 8 November 2021 | 26 | −37.8% | 174 | −48.2% | 175 |
| 8 November 2021 | 52 | −50.8% | 356 | −72.6% | 357 |
| 9 November 2022 | 26 | −9.5% | 0 | −18.4% | 0 |
| 9 November 2022 | 52 | −13.4% | 0 | −20.0% | 0 |
| 6 October 2025 | 26 | −31.1% | 175 | −49.1% | 175 |
These results describe a past period and do not show what will happen in the future.
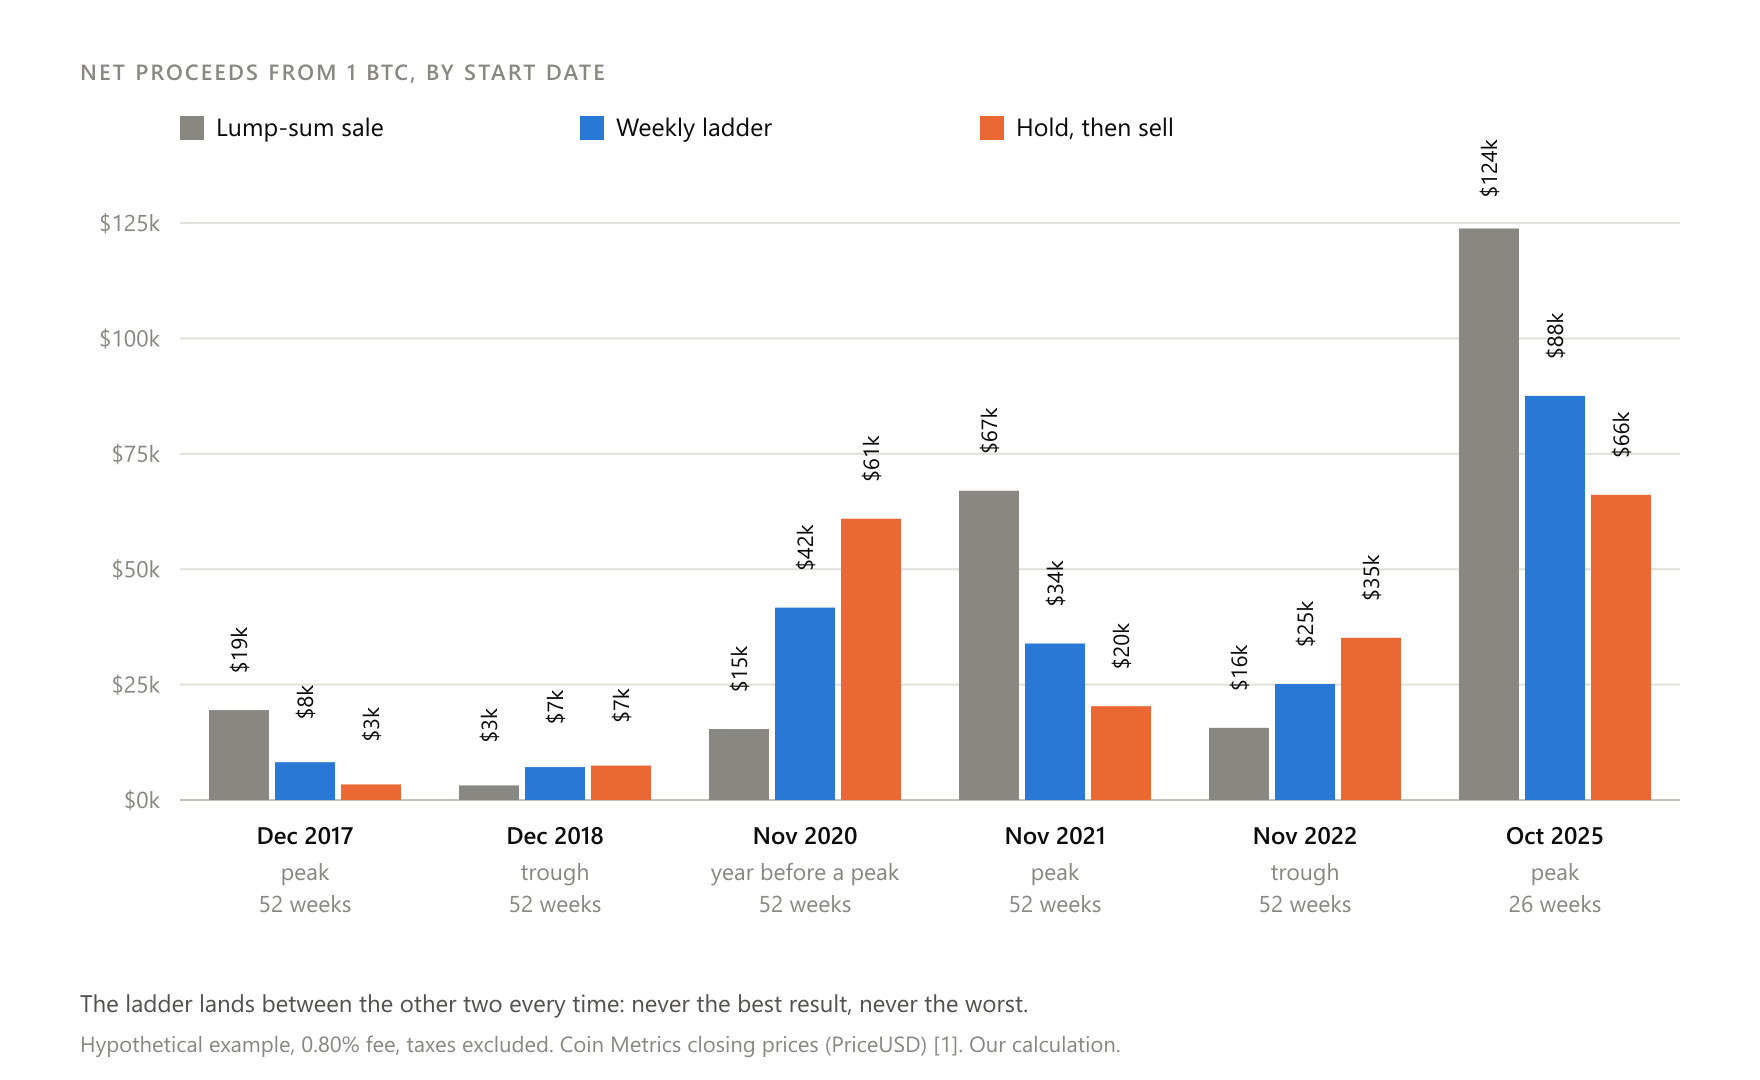
In all eleven windows the ladder landed between the two alternatives. It never gave the highest result and never the lowest (our calculation). This is no coincidence, because it follows from the mechanism itself: when a fixed quantity is sold, the average sale price is the average of the prices along the way.
In the windows that started at a peak, the ladder limited the loss compared with holding. But it stayed far below the lump-sum sale, and its value sat below it almost the whole time. In the windows that started at a trough, the ladder had a smaller drawdown than holding, but it left a large part of the rise behind.
Second simulation: price ladder
Hypothetical example. The rule is as follows:
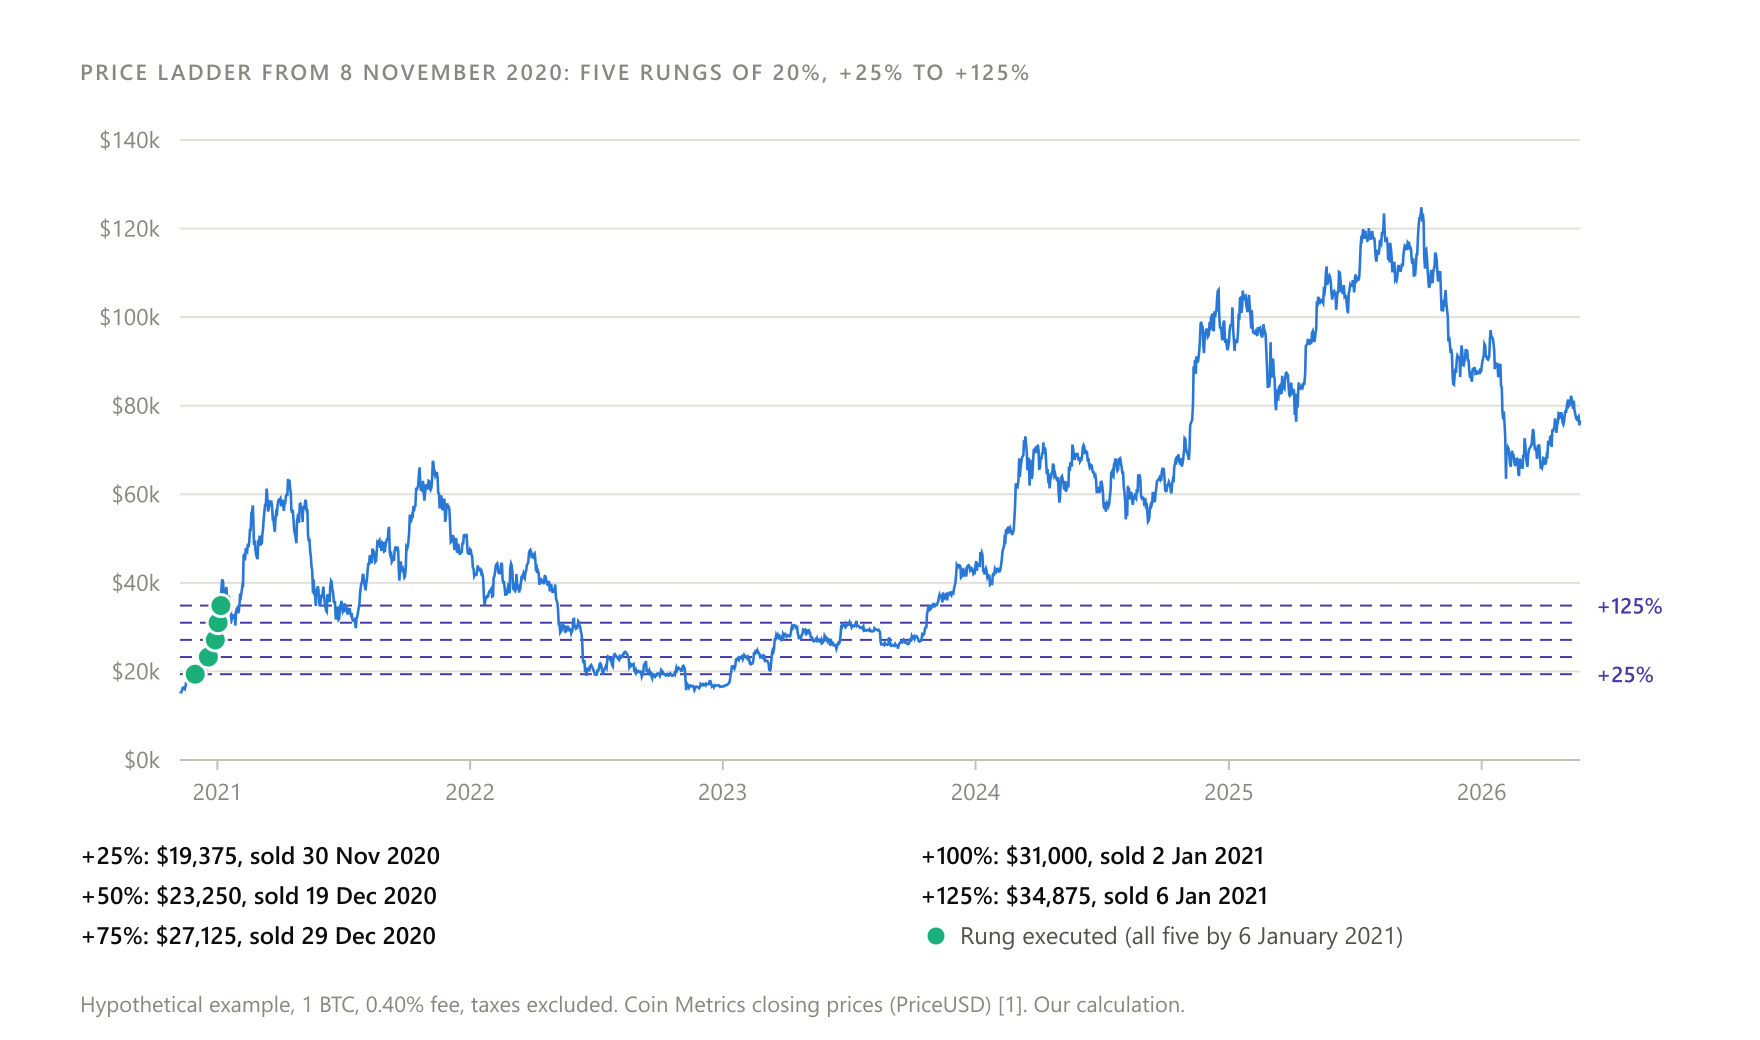
Position and rungs: a starting position of 1 BTC, illustrative. Five limit sell orders, each for 20% of the starting position, at +25%, +50%, +75%, +100% and +125% above the closing price on the start date.
Execution: a rung counts as executed on the first day the closing price reaches it, at the rung price. Because we use only closing prices, real orders could have executed earlier, on intraday highs.
Costs and valuation: maker fee 0.40% [11]. Taxes are ignored. Any BTC not yet sold is valued at the closing price on the end date, with no exit fee. Holding is valued the same way.
Data and measures: Coin Metrics prices, PriceUSD series, US dollars [1]. Days below are defined as in the first simulation. CAGR is given only for periods longer than one year.
| Start | End | Rungs executed | Ladder: value (return, CAGR) | Ladder: maximum drawdown | Ladder: days below | Hold: value (return, CAGR) | Hold: maximum drawdown | Hold: days below | Lump-sum sale, net |
|---|---|---|---|---|---|---|---|---|---|
| 8 November 2020 | 8 November 2021 | 5 (30 November 2020 to 6 January 2021) | 27,017 (+74.3%) | −10.7% | 2 | 67,542 (+335.8%) | −53.1% | 2 | 15,376 |
| 8 November 2020 | 23 May 2026 | 5 | 27,017 (+74.3%, 10.6% a year) | −10.7% | 2 | 76,620 (+394.3%, 33.5% a year) | −76.7% | 2 | 15,376 |
| 8 November 2021 (peak) | 8 November 2022 | 0 | 18,521 (−72.6%) | −72.6% | 364 | 18,521 (−72.6%) | −72.6% | 364 | 67,001 |
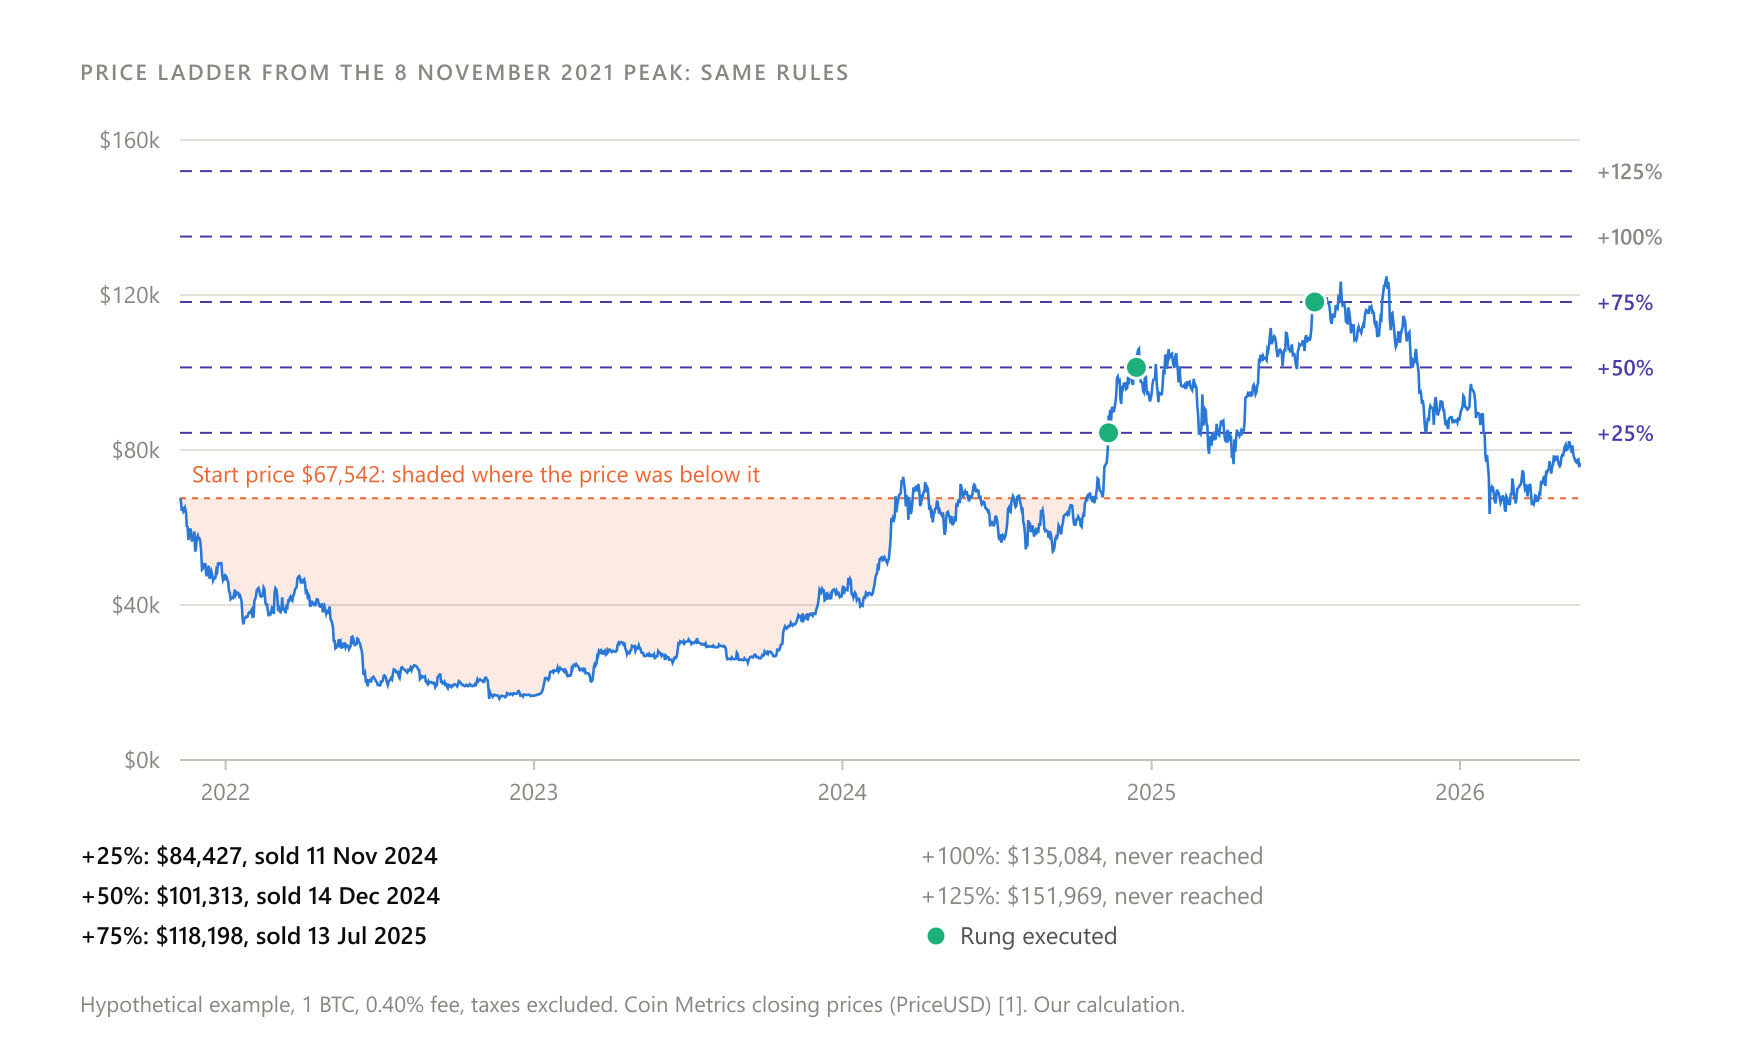
| 8 November 2021 (peak) | 23 May 2026 | 3 (11 November 2024, 14 December 2024, 13 July 2025) | 91,192 (+35.0%, 6.8% a year) | −76.7% | 845 | 76,620 (+13.4%, 2.8% a year) | −76.7% | 845 | 67,001 |
| 9 November 2022 (trough) | 9 November 2023 | 5 (13 January to 8 November 2023) | 27,467 (+74.3%) | −11.6% | 0 | 36,675 (+132.7%) | −20.0% | 0 | 15,632 |
| 9 November 2022 (trough) | 23 May 2026 | 5 | 27,467 (+74.3%, 17.0% a year) | −11.6% | 0 | 76,620 (+386.2%, 56.4% a year) | −49.1% | 0 | 15,632 |
| 6 October 2025 (peak) | 23 May 2026 | 0 | 76,620 (−38.6%) | −49.1% | 229 | 76,620 (−38.6%) | −49.1% | 229 | 123,826 |
These results describe a past period and do not show what will happen in the future.
The ladder that started on 8 November 2020 sold the whole position by 6 January 2021, with its highest rung at $34,875. In the months that followed the price passed $60,000. The ladder from the 2021 peak sold nothing during 2022 and followed the whole 72.6% fall. Its first rungs executed only in late 2024. Until then its path was identical to holding, and the difference at the end comes from the three rungs that executed before the price fell back. The ladder from the October 2025 peak also sold nothing up to 23 May 2026.
In the data we studied, the price ladder either finished far too early or never started. Which of the two happened depended entirely on the start date and the spacing of the rungs.
What the evidence cannot show
The simulations use a single asset, Bitcoin, which survived. Many cryptocurrencies that boomed in the same periods no longer exist or have been delisted from exchanges. We include no data for them, and the results of an exit from them could be very different.
We assumed a single fee tier, daily closing prices and zero taxes. The 26- and 52-week durations and the rung spacing are our own choices, and other parameters would give other numbers. Finally, no simulation can show which start date will turn out to be a peak or a trough, and that is exactly the problem we started from.
What it costs and trades away
The first cost is fees. On Kraken Pro's first tier, the fee was 0.40% for maker orders and 0.80% for taker orders on 9 October 2026 [11]. For instant and recurring trades in the Kraken app, the platform states a 1% fee plus a spread (the difference between the market price and the price the customer receives), which, it notes, may vary [11].
An example (our calculation): someone who sells $1,000 a week for 52 weeks pays $208 at 0.40%, $416 at 0.80% and $520 at 1%, before any spread. In the hypothetical example in section 5, the ten sales cost $348.94 in fees, 0.80% of gross proceeds.
Where commissions are charged per trade, the cost multiplies with the number of sales. The Morningstar article, passing on Wallick's warning about costs, notes that selling in ten instalments can then cost ten times as much in brokerage commissions as a single sale [2].
The second cost is opportunity cost: the return lost because the money is somewhere else. In the rising windows of the first simulation, the ladder left a large part of the rise behind. From 8 November 2020, for example, it gave $41,679 against $60,942 for holding (our calculation). In the falling windows it lost to the lump-sum sale in the same way.
The third cost is time and discipline. A 52-week plan means 52 decisions, or 52 times the owner has to not change their mind.
The behaviour behind it
In 1985 Hersh Shefrin and Meir Statman published a paper in the Journal of Finance whose title became a definition: "The Disposition to Sell Winners Too Early and Ride Losers Too Long" [18]. Using data on trades by individual investors, they recorded a marked tendency to avoid realising losses [19]. The pattern was named the disposition effect: the tendency to sell winning positions early and hold losing positions for too long.
In 1998 Terrance Odean examined 10,000 accounts at a large brokerage and found a strong preference for realising gains rather than losses. That preference was not justified by the later performance of the portfolios [20]. In Bitcoin, Jürgen Schatzmann and Bernhard Haslhofer used transfers to exchanges as a proxy for sales. They found the same effect with varying intensity, not consistently present, and more marked from 2017 onwards [21].
Taking profits with a ladder responds to something real: the difficulty of one large decision, and the regret that follows whatever the outcome. When the decision is split into many pieces, no single piece is big enough to be "the mistake".
There is also another reading, our own. A ladder that sells into rising prices formalises exactly the tendency Shefrin and Statman described: selling winning positions early. The strategy does not abolish the psychology. It organises it, and it can amplify it. Moreover, no plan protects against being abandoned. A plan that stops halfway because the price rose or fell sharply is no longer the plan that was designed.
When exit plans stumbled
June 2017, GDAX. The large market order and the chain of stop-loss orders described in section 7 briefly sent ETH to $0.10 [13]. GDAX did not reverse the trades, but it credited those whose stop-loss orders or leveraged positions were executed because of the move [14]. The matter was closed with that credit.
November 2021, targets that were not reached. One of the most widely followed price models of the time, the analyst PlanB's "floor model", had a "worst case" of a November 2021 close at $98,000. Bitcoin closed the month near $57,000, and PlanB himself called it the model's first miss [22]. Any ladder with rungs near such targets did not execute, and the price entered the fall of 2022 (our reading, consistent with the second simulation from the 2021 peak).
November 2022, FTX. On 8 November 2022 FTX halted all crypto withdrawals [16]. On 11 November, FTX, Alameda Research and about 130 affiliated companies filed for protection from creditors under Chapter 11 of the US bankruptcy code [23]. Anyone who had sold and was holding the proceeds on the platform became a creditor of a bankrupt company.
The trust that manages the estate, the FTX Recovery Trust, set 31 March 2026 for the fourth distribution to creditors, of about $2.2bn [24]. Based on what we checked up to 9 October 2026, no completion of the process has been reported.
March 2023, USDC. On 11 March 2023 Circle, issuer of the USDC stablecoin, announced that $3.3bn of its reserves were held at Silicon Valley Bank, which had just collapsed [17]. Sources differ on the lowest point: The Block reports that USDC fell as low as $0.88 [17], while Decrypt reports $0.87 [25]. By 14 March 2023 USDC had returned close to its dollar peg, and Circle said the $3.3bn deposit was now fully available [25]. Anyone who had converted sale proceeds into USDC saw their value drop temporarily by 12% to 13% (our calculation).
October 2025, losses of peg on one exchange. In the fall of 10 October 2025, USDe, BNSOL and WBETH temporarily lost their pegs on Binance. The platform announced compensation of $283m [15]. According to Binance, the compensation covered futures, margin and loan users who held these assets as collateral, as well as verified losses from internal transfers and redemptions of the platform's yield products [15]. The head of Ethena, issuer of USDe, disputed the description, arguing that only one venue had diverged from prices in the deepest markets [15]. In October 2025 Binance said it was still reviewing pending compensation claims, and no final total has been reported in the sources we examined [15].
Common misconceptions
"If I sell a fixed amount, I get the DCA advantage in reverse." The opposite happens [2]. Over the ten months of the hypothetical example in section 5, the arithmetic mean of the prices, which is the average price when a fixed quantity is sold, was $43,617.01. The harmonic mean, which is the average price when a fixed money amount is sold, was $41,367.56. The difference is 5.2% against the seller of fixed amounts (our calculation).
"A ladder catches the top." By definition it does not. Thomas Guy, who sold his whole position before the collapse, received on average about 40% of the peak price Jones reports (our calculation from [9]). In our simulations, the ladder either finished long before the top or did not execute at all.
"Selling with a ladder always reduces risk." Compared with holding, the maximum drawdown was smaller or equal in every window of the first simulation. Compared with a lump-sum sale, which turns the whole position into cash on day one, price risk was greater in every window. Whether it "reduces risk" depends on what it is compared with.
"Newton said he could calculate the motions of the heavenly bodies but not the madness of people." Odlyzko, who studied the documents, writes that Newton allegedly said it [8]. The line circulates widely, but its documentation is not strong.
"Guy sold from £300 to £600." That was the version in the Dictionary of National Biography. His account book shows that he started at 340%, sold once at 600% and finished at 525% [9].
The open questions
A fixed schedule is by definition less efficient than a flexible one. Constantinides's 1979 critique targeted pre-set buying schedules: a policy that uses new information dominates a schedule that ignores it [3][4]. If the same logic applies to selling, the ladder's discipline is bought at some expected cost. The question is whether individual investors, who according to Odean systematically sell the wrong pieces [20], would actually make use of that flexibility.
When the goal is diversification, speed may matter more. Vanguard's Daniel Wallick, speaking to Morningstar about a concentrated position in a single stock, argued that the benefit of diversification (spreading risk across many holdings) is "almost the primary function" to solve. In his view, getting there "as quickly as possible" probably makes most sense [2]. From this angle, a six-month ladder out of an oversized position leaves the risk open for months.
Splitting makes economic sense mainly for large orders. The Almgren and Chriss framework justifies splitting a sale through the effect a large order has on the price [5]. For a small order in a liquid order book, that effect is small. In that case, splitting seems to be mainly about time and psychology, not execution (our reading).
Comfort has to be weighed against cost. Zoll concludes that reverse gradual selling may make sense if it makes the investor more comfortable than a lump-sum sale. That benefit, however, has to be weighed against potentially lower returns, added costs and a delayed goal [2].
The risks for the reader
The first risk is the platform. While crypto waits to be sold, and while proceeds stay on an exchange, they depend on its solvency. The FTX case showed that access can be cut off within a day.
The second is the asset that receives the proceeds. A stablecoin can lose its peg, even temporarily, as USDC did in 2023 and USDe did on one exchange in 2025.
The third is execution. A large market order can fill at prices much worse than expected. A ladder of limit orders may never execute.
The fourth is opportunity cost. Every piece that is sold takes no part in whatever follows, whether that is a fall or a rise.
The fifth is the plan itself. Its parameters are chosen without knowing the future, and abandoning a plan halfway creates an outcome nobody designed.
For account security, the general rules apply. Use only the official app or official website of each platform and check the address before every login. Enable two-factor authentication and, where available, a withdrawal address allowlist. Check the price at which each order executed and keep a record of every sale.
The tax treatment of each sale differs from country to country. The relevant rules can also change.
Where to go next
Taking profits with a ladder is the other side of DCA, to which the Crypto 101 series devotes a separate article. Bitcoin, the asset used in our examples, is explained in its own article in the series. Related strategies, such as portfolio rebalancing and stop-losses, are covered in their own articles.
Sources
- P: Coin Metrics, Community Data, btc.csv (PriceUSD), github.com/coinmetrics/data, May 2026
- S: A. Zoll, Morningstar UK, Does Pound-Cost Averaging Out of a Position Make Sense?, morningstar.co.uk/uk/news/104748, January 2013
- P: G. M. Constantinides, A Note on the Suboptimality of Dollar-Cost Averaging as an Investment Policy, Journal of Financial and Quantitative Analysis 14(2), ideas.repec.org/a/cup/jfinqa/v14y1979i02p443-450_00.html, June 1979
- S: D. D. Cho, E. Kuvvet, Dollar-Cost Averaging: The Trade-Off Between Risk and Return, Journal of Financial Planning 28(10), financialplanningassociation.org/article/journal/OCT15-dollar-cost-averaging-trade-between-risk-and-return, October 2015
- P: R. Almgren, N. Chriss, Optimal execution of portfolio transactions, Journal of Risk 3(2), risk.net/journal-risk/2161150/optimal-execution-portfolio-transactions, 2000
- S: BenefitsPro, Lump-sum investing vs. dollar-cost averaging, benefitspro.com/2012/10/31/lump-sum-investing-vs-dollar-cost-averaging, October 2012
- P: Kraken, Recurring Orders on Kraken, support.kraken.com/hc/en-us/articles/recurring-orders, June 2026 (platform source)
- S: A. Odlyzko, Isaac Newton and the perils of the financial South Sea, Physics Today 73(7), physicstoday.aip.org/features/isaac-newton-and-the-perils-of-the-financial-south-sea, July 2020
- P: T. R. Jones, The Holdings of Thomas Guy in the South Sea Company, The Baptist Quarterly 9.3, gospelstudies.org.uk/biblicalstudies/pdf/bq/09-3_170.pdf, July 1938
- P: Coin Metrics, Price (metric definition), docs.coinmetrics.io/network-data/network-data-overview/market/price, October 2026
- P: Kraken, Fee Schedule, kraken.com/features/fee-schedule, October 2026 (platform source)
- P: Kraken, How trading fees work on Kraken, support.kraken.com/articles/201893638, October 2026 (platform source)
- S: SiliconANGLE, Coinbase reimburses losses from Ethereum 'flash crash' that sent price plunging to 10 cents, siliconangle.com/2017/06/25/coinbase-reimburses-users-etherum-flash-crash-saw-price-drop-10-cents, June 2017
- S: TechCrunch, Coinbase is reimbursing losses caused by the Ethereum flash crash, techcrunch.com/2017/06/24/coinbase-is-reimbursing-losses-caused-by-the-ethereum-flash-crash, June 2017
- S: The Block, The Daily: Binance pays $283 million in compensation following Friday's depegs, theblock.co/post/374407, October 2025
- S: CoinDesk, FTX Exchange Halts All Crypto Withdrawals, coindesk.com/business/2022/11/08/ftx-exchange-halts-all-crypto-withdrawals, November 2022
- S: The Block, USDC will remain redeemable 1 for 1 with U.S. dollar, Circle says, theblock.co/post/219075, March 2023
- P: H. Shefrin, M. Statman, The Disposition to Sell Winners Too Early and Ride Losers Too Long: Theory and Evidence, Journal of Finance 40(3), cir.nii.ac.jp/crid/1360011145247011968, July 1985
- S: P. J. Phillips, McGraw Hill ANZ, People Are Afraid to Let Their Winners Run, mheducation.com.au/anz-finance-blog-let-winners-run, April 2020
- P: T. Odean, Are Investors Reluctant to Realize Their Losses?, Journal of Finance 53(5), faculty.haas.berkeley.edu/odean/papers/disposition/disposition.html, October 1998
- P: J. E. Schatzmann, B. Haslhofer, Exploring investor behavior in Bitcoin: a study of the disposition effect, Digital Finance 5(3), arxiv.org/abs/2010.12415, July 2023
- S: Cointelegraph, Bitcoin fails 'worst-case scenario' monthly close for the first time, cointelegraph.com/markets/bitcoin-fails-worst-case-scenario-monthly-close-for-the-first-time-starts-december-sub-57k, December 2021
- S: Benzinga, FTX US Stops Processing Withdrawals, 1 Day After Bankman-Fried Says Company Is 100% Liquid, benzinga.com/markets/cryptocurrency/22/11/29685331, November 2022
- S: CoinDesk, Sam Bankman-Fried's bankrupt exchange FTX set to repay creditors $2.2 billion this month, coindesk.com/business/2026/03/18/sam-bankman-fried-s-bankrupt-exchange-ftx-set-to-repay-creditors-usd2-2-billion-this-month, March 2026
- S: Decrypt, SVB Collapse Meant Protecting 'a Digital Dollar From the Banking System': Circle CEO, decrypt.co/123435/svb-collapse-meant-protecting-digital-dollar-banking-system-circle-ceo, March 2023
This article is educational and for general information. It is not investment or financial advice and does not take your personal circumstances into account. Examples and simulations describe the past and do not predict future returns. Investing in crypto can lead to the loss of all the money invested. The facts in crypto move quickly, so verify them before you act on anything here.