
DCA (dollar cost averaging) is the strategy of investing the same amount of money at regular intervals, whatever the price happens to be that day.
The problem it tries to solve is old and hard. Nobody knows in advance whether today's price is a good one or a bad one. Someone who puts in a large sum at once can land right at the top. Someone who waits for "the right moment" may never recognise it.
This article explains how the strategy works, where it came from, what studies of traditional markets found, and what our own bitcoin simulations show. It also covers what the strategy costs, how it is applied, and where it has failed.
The article is informational and is not investment advice. Every example and every simulation in it describes the past.
The problem it tries to solve
On 8 November 2021 bitcoin closed at 67,541.76 US dollars. Twelve months later, on 9 November 2022, it closed at 15,758.29 dollars. That is a fall of 76.7% (our calculation, using Coin Metrics closing prices [1][2]).
Anyone who invested all their savings on the first day watched three quarters of their value disappear within a year. They did not pick the wrong coin. They picked the wrong day.
That fear is the core problem. A lump sum investment, putting the whole amount in at once, exposes you fully to the moment you chose. If a fall follows, the loss comes with regret attached: "if only I had waited".
Waiting is not neutral either. A 2012 Vanguard study notes that delaying an investment is itself a form of market timing, something few investors succeed at [3].
Charles Schwab, which sells investment services, writes that timing the market is "typically impossible even for professional investors". On the same page it concedes that over long periods DCA tends to produce lower returns than lump sum investing [4].
The strategy's promise was stated plainly as early as 1960. A promotional text for a monthly investment plan in the American stock market said that regular payments removed "the perplexing old problem of exactly when to invest" [5].
Where the idea came from
The idea is much older than crypto. Who first used the term is not clear.
Wikipedia attributes the term to Benjamin Graham and his 1949 book The Intelligent Investor [8]. The economists Gary Smith and Heidi Margaret Artigue, however, write that Lucile Tomlinson championed cost-averaging plans in Barron's columns and in Successful Investing Formulas, first published in 1947 [6]. The behavioural finance researcher Meir Statman writes that the method's popularity can be traced back at least to the 1940s [7].
According to Smith and Artigue, Tomlinson called the method "the unbeatable formula", in a book with a preface by Graham [6].
Academics were far more sceptical. In 1979 George Constantinides published an article in the Journal of Financial and Quantitative Analysis whose title says a great deal: "A Note on the Suboptimality of Dollar-Cost Averaging as an Investment Policy" [9]. According to Statman, Constantinides showed that the arguments for DCA are inconsistent with rational behaviour [7].
In 1992/93 J.R. Knight and L. Mandell published an article in the Financial Services Review with an even blunter title: "Nobody Gains from Dollar Cost Averaging". They examined DCA using graphical analysis, historical stock market returns and Monte Carlo simulations. They concluded that no benefit accrues, and that two alternatives, optimal rebalancing and simple buy-and-hold, did better in all three analyses [10].
The criticism also produced proposed improvements. In August 1988 Michael Edleson published "Value Averaging: A New Approach to Accumulation" in the AAII Journal. The book Value Averaging was first printed in 1991, again in 1993, and reissued by Wiley in 2006 [11].
According to the foreword to the reissue, value averaging combines gradual buying with rebalancing [11]. Rebalancing means bringing a portfolio back to its original proportions.
In crypto the same logic circulates as "stacking sats": steadily accumulating small amounts of bitcoin, counted in satoshis, its smallest unit. Today exchanges offer recurring buy features. The Kraken app, for example, allows automatic purchases on a daily, weekly, biweekly or monthly schedule [12].
1954 and the 40-dollar plan
On 12 May 1954, at the Adolphus Hotel in Dallas, New York Stock Exchange president G. Keith Funston spoke to business executives about a new product [13].
The Monthly Investment Plan, he said, had been "introduced in January of this year". It let an investor buy, for example, "$40 worth of XYZ stock each month or each quarter" at the prevailing market price, without borrowing. The investor was credited with fractional shares [13].
In the first three months, Exchange member firms opened some 15,000 accounts. The favourite stocks were RCA, Dow Chemical, American Telephone & Telegraph, General Motors and Standard Oil of New Jersey [13].
The plan was part of a wider campaign under the slogan "Own Your Share of American Business" [13]. Funston did not hide its political aim. He said broader share ownership would bring a more favourable political climate for business, and at one point told his audience: "I need not remind you that there is no Stock Exchange in Moscow" [13].
Six years later, in February 1960, a text in a local North Carolina newspaper presented the plan to readers [5]:
| What the 1960 text said | Detail |
|---|---|
| Shareowners in the US | 12.5 million |
| Minimum payment | 40 dollars a quarter ("45 cents a day") |
| Maximum payment | 1,000 dollars a month |
| The warning | "You'll lose, of course, if you sell shares at a price lower than their average cost" |
The historian Janice Traflet devotes a chapter to the plan, titled "Selling Stocks on the Monthly Plan", in her book A Nation of Small Shareholders (Johns Hopkins University Press, 2013). The book examines the Exchange's programme to broaden the base of small shareholders from the early 1950s to the 1970s [14].
That is what the documents show. What follows is our reading.
The first mass-market product for gradual buying was not born in a university. It was born as a product, with a promotional campaign and a political frame. Its main selling point, that it solves the problem of when to buy, is almost word for word the one crypto platforms use today. Its warning about average cost is just as current.
How it works, from zero
Think of someone who fills up the car every week. They can always buy 30 litres, so the amount they pay changes with the price. Or they can always spend 40 euros, so the litres change. The second option is DCA.
When fuel is cheap, the 40 euros buy more litres. When it is expensive, they buy fewer. Without any forecast, the driver automatically buys more in the cheap weeks.
The result has a mathematical explanation. With a fixed amount, the average cost per unit equals the harmonic mean of the purchase prices. The harmonic mean can never be higher than the simple arithmetic average of the same prices [8][15]. If you bought a fixed quantity instead, your average cost would be exactly the arithmetic mean [15].
The analogy stops working in two places.
First, you burn fuel, but you hold crypto. What matters in the end is not only how much you paid, but also what your holdings are worth when you need them.
Second, fuel prices usually move within a narrow range. A cryptocurrency can fall for years, or never recover.
A lower average cost does not necessarily mean more money. A 2023 preprint titled "SmartDCA superiority", which has not been peer reviewed, shows this clearly. One variant the authors tested achieved a better average cost than DCA in bitcoin over 2017 to 2023. In total, however, it spent just 0.166 dollars on bitcoin, against 1,827 dollars for DCA [15].
A hypothetical example, step by step
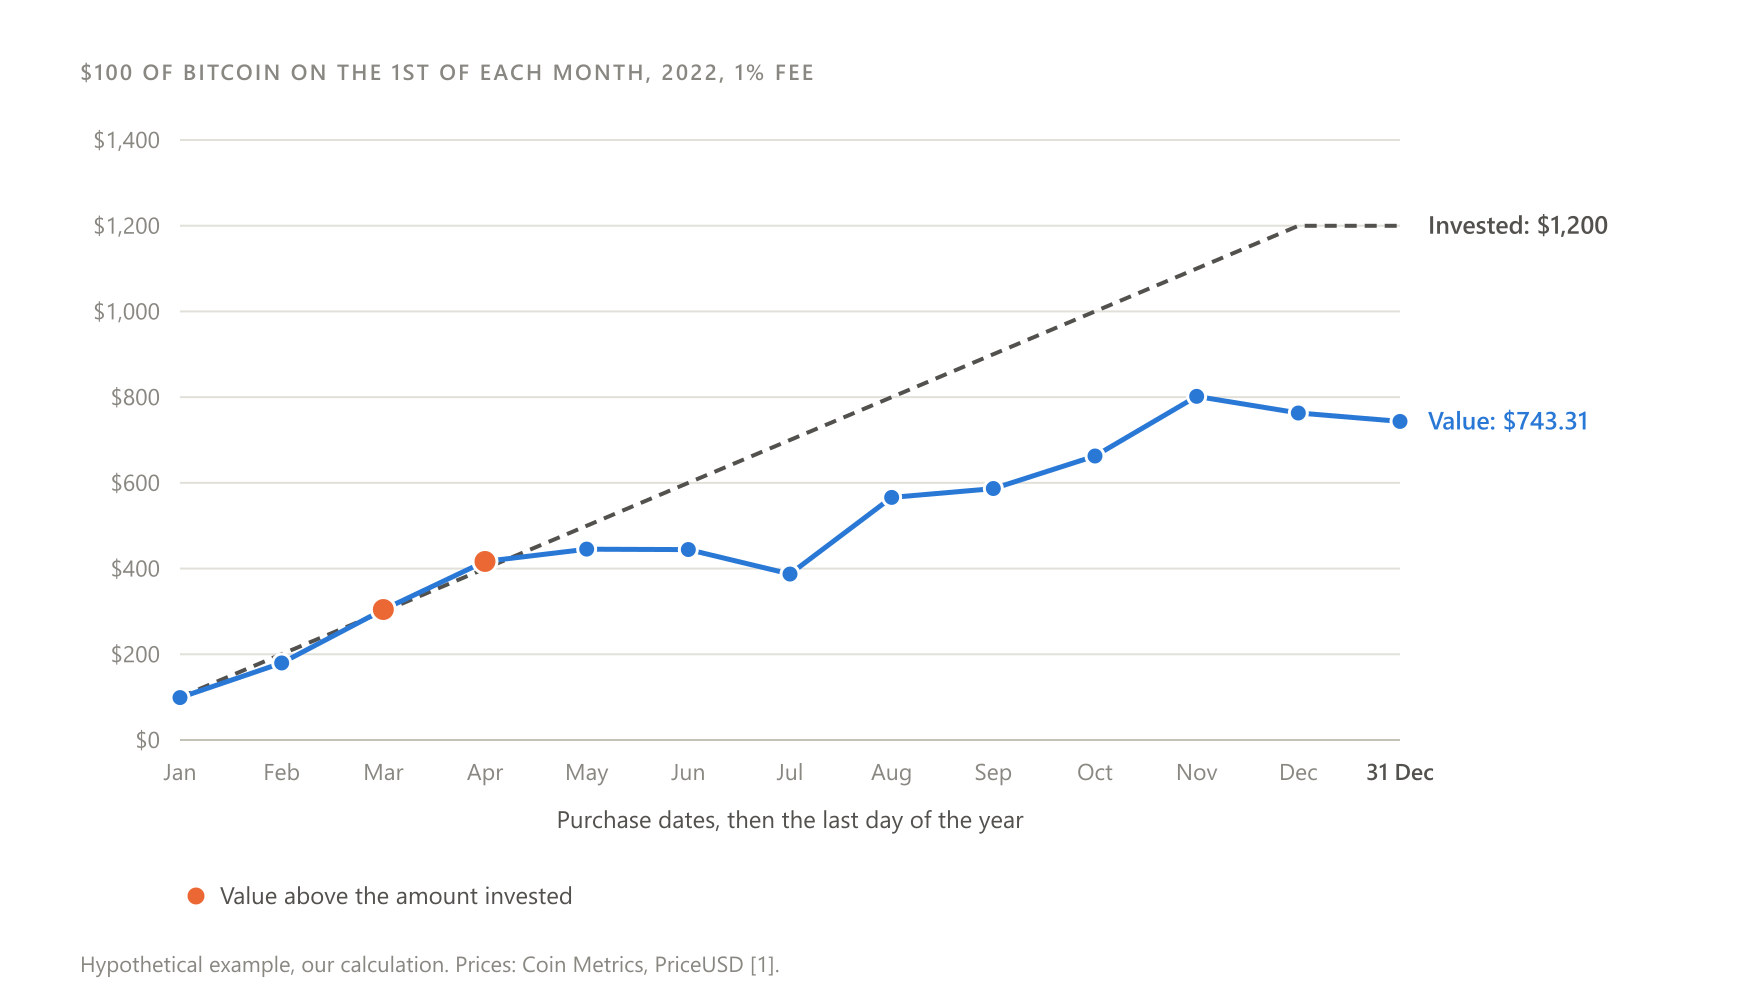
The following is a hypothetical example (our calculation):
| Parameter | Choice |
|---|---|
| Amount and frequency | 100 US dollars of bitcoin on the 1st of each month |
| Period | January to December 2022 (12 purchases) |
| Price | The day's end-of-day UTC close from Coin Metrics' PriceUSD series [1][2] |
| Fee | 1% per purchase, the level CoinJar publishes for recurring buys on its UK help page (checked 8 October 2026) [16]. Each time, one dollar goes to the fee and 99 buy bitcoin. |
| Taxes | Ignored |
Bitcoin and the amounts are illustrative and are not a recommendation. We chose 2022 because it does not flatter the strategy.
| Date (2022) | BTC price (USD) | BTC bought | Total BTC | Amount invested (USD) | Average cost (USD) | Position value (USD) |
|---|---|---|---|---|---|---|
| 1 January | 47,560.01 | 0.00208158 | 0.00208158 | 100 | 48,040.41 | 99.00 |
| 1 February | 38,787.96 | 0.00255234 | 0.00463392 | 200 | 43,160.01 | 179.74 |
| 1 March | 44,334.46 | 0.00223303 | 0.00686694 | 300 | 43,687.55 | 304.44 |
| 1 April | 46,250.34 | 0.00214052 | 0.00900747 | 400 | 44,407.59 | 416.60 |
| 1 May | 38,459.23 | 0.00257415 | 0.01158162 | 500 | 43,171.84 | 445.42 |
| 1 June | 29,825.92 | 0.00331926 | 0.01490088 | 600 | 40,266.06 | 444.43 |
| 1 July | 19,341.86 | 0.00511843 | 0.02001932 | 700 | 34,966.23 | 387.21 |
| 1 August | 23,331.44 | 0.00424320 | 0.02426252 | 800 | 32,972.67 | 566.08 |
| 1 September | 20,105.46 | 0.00492403 | 0.02918655 | 900 | 30,836.12 | 586.81 |
| 1 October | 19,311.86 | 0.00512638 | 0.03431294 | 1,000 | 29,143.53 | 662.65 |
| 1 November | 20,483.97 | 0.00483305 | 0.03914598 | 1,100 | 28,099.95 | 801.87 |
| 1 December | 16,961.29 | 0.00583682 | 0.04498280 | 1,200 | 26,676.86 | 762.97 |
The first months. In January the investor buys 0.00208158 BTC. In February the price falls, and the same 99 dollars buy more bitcoin. In July, with the price below 20,000 dollars, they buy almost two and a half times January's quantity.
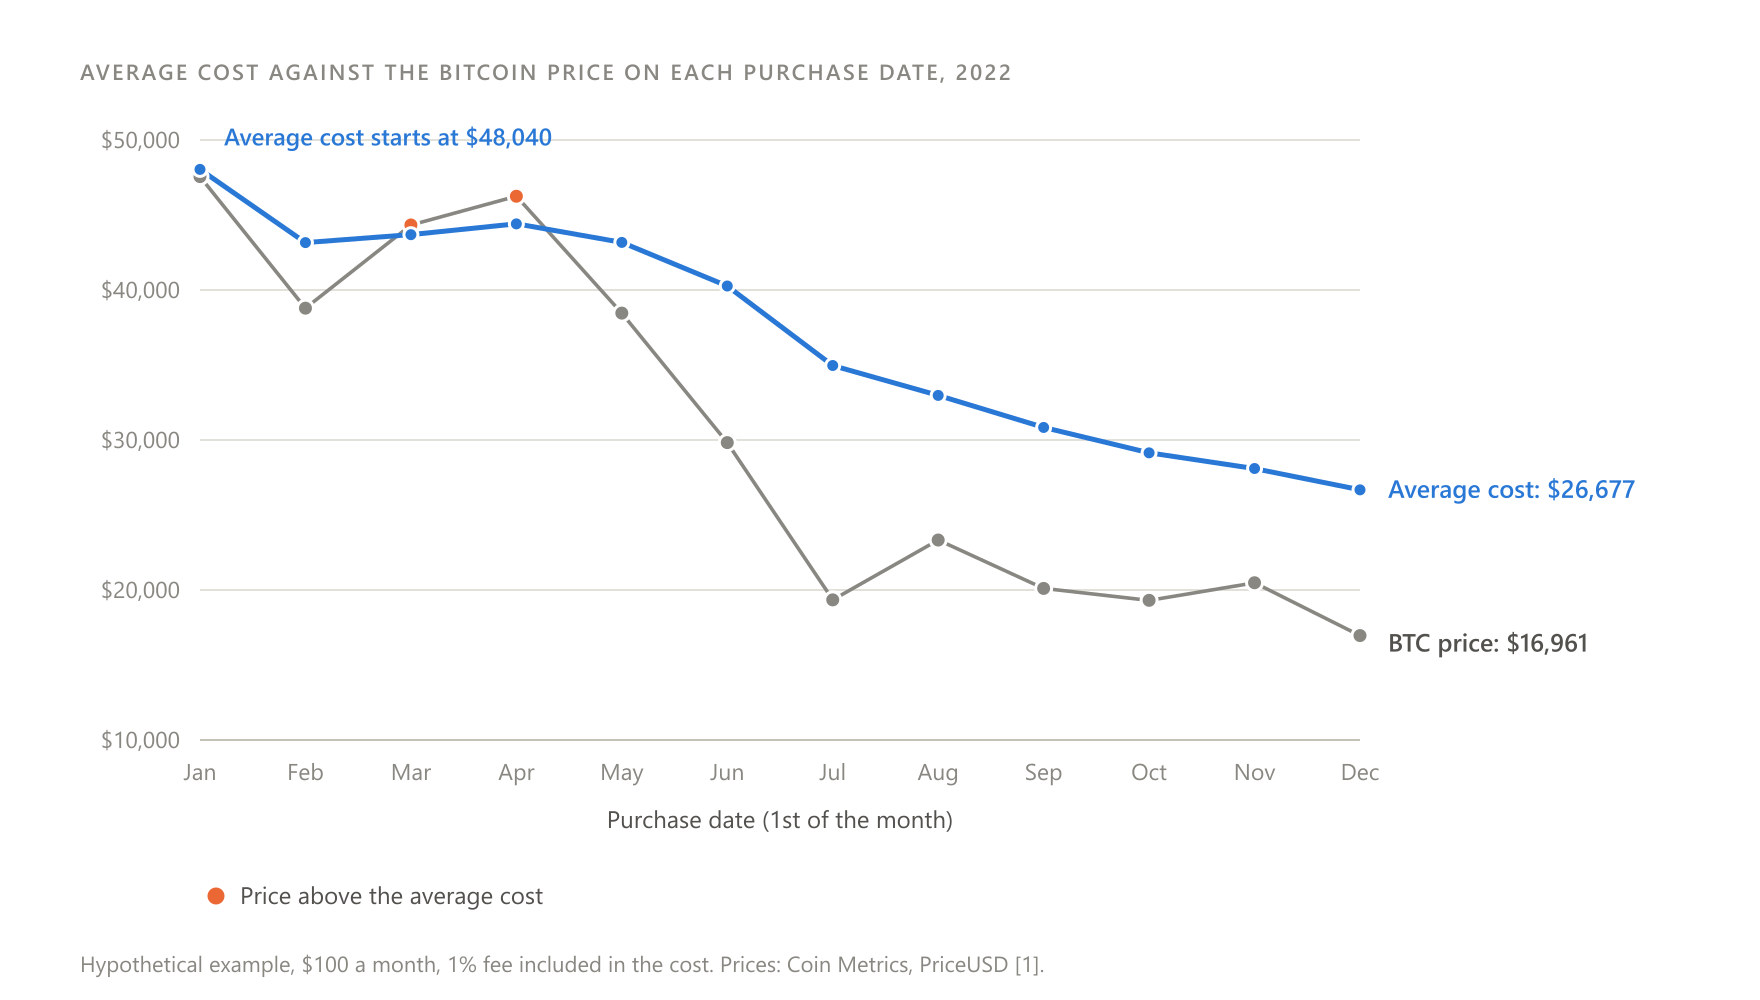
The average cost. The simple average of the twelve prices is 30,396.15 dollars. The harmonic mean is 26,410.09 dollars. The average cost including fees is 26,676.86 dollars (our calculation).
The result at year end. On 31 December 2022 bitcoin closed at 16,524.22 dollars. The 0.04498280 BTC were worth 743.31 dollars, a loss of 38.1% on the 1,200 dollars invested (our calculation). The average cost fell, but the position was losing money.
The lump sum comparison. A lump sum investment of 1,200 dollars on 1 January 2022, with the same 1% fee (12 dollars), would have bought 0.02497897 BTC. On 31 December 2022 that was worth 412.76 dollars, a loss of 65.6% (our calculation).
If the same quantities were held with no further purchases (our calculation):
| Valuation date | DCA value (USD) | Lump sum value (USD) |
|---|---|---|
| 31 December 2023 | 1,899.05 | 1,054.54 |
| 31 December 2024 | 4,200.93 | 2,332.78 |
| 23 May 2026 | 3,446.58 | 1,913.89 |
These results describe a past period and do not show what will happen in the future.
The rules that define it
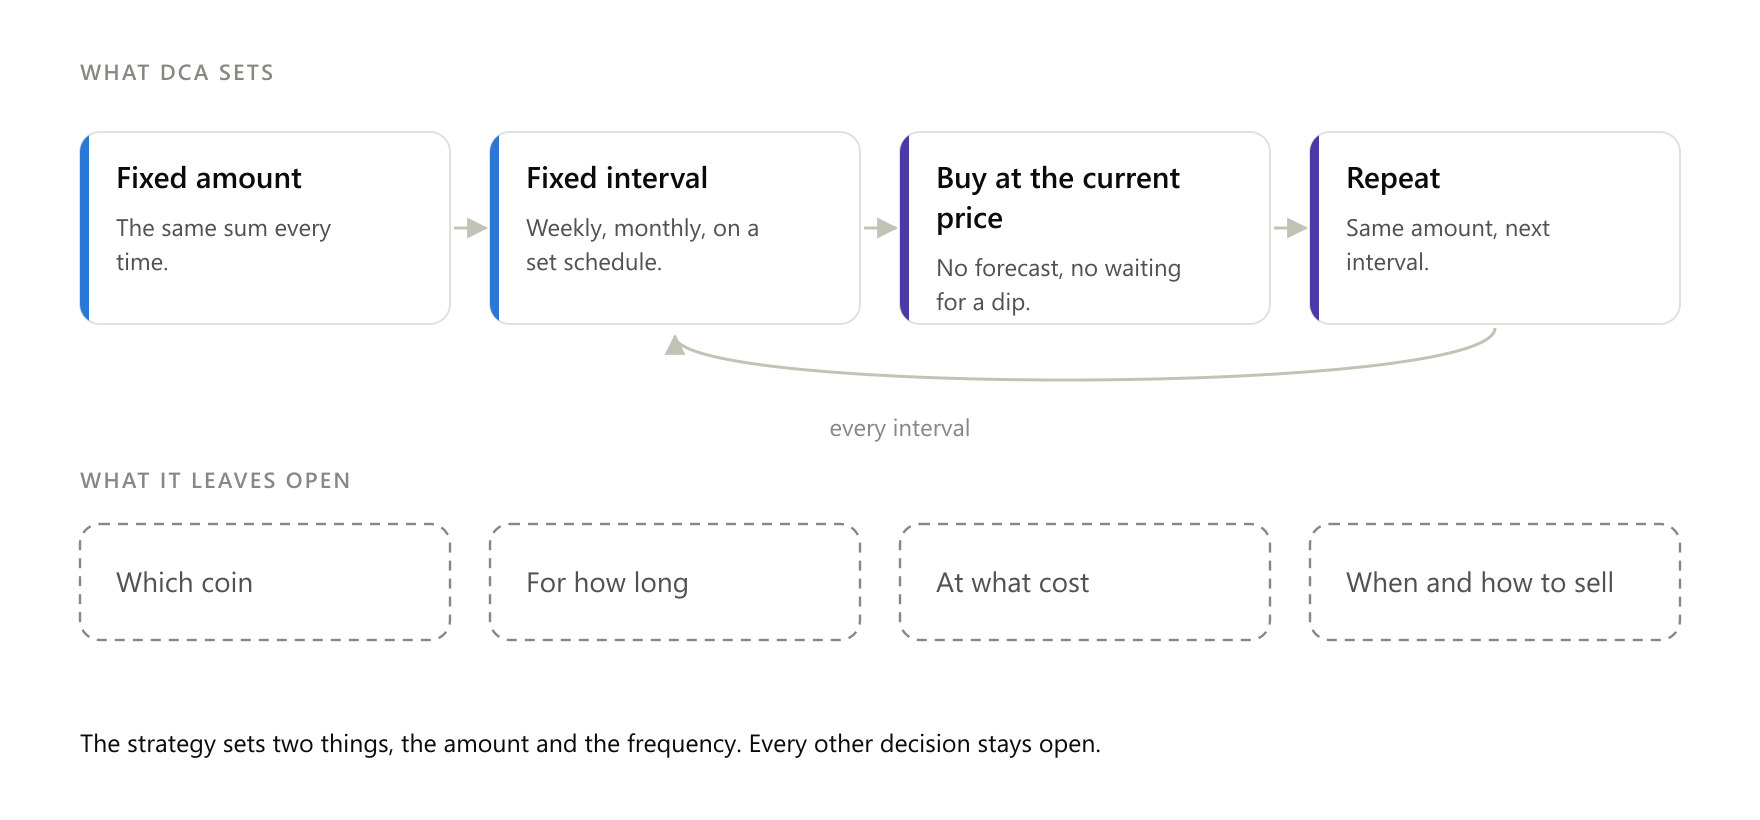
DCA sets only two parameters: how much money goes in each time, and how often [8].
The amount determines how fast the position grows and how heavily the fee weighs. A fixed charge per purchase weighs far more on a small amount.
The frequency determines how many executions take place, and so how many times a fee or spread is paid. The spread is the gap between the buying and selling price that a platform builds into its quote. Frequency also determines how closely the investor buys into day-to-day swings.
Everything else the strategy leaves open. It does not say which asset, for how long, at what cost, where the money waits before each purchase, or when and how to sell.
The last omission is the most important. As the 1960 text already warned, a loss is realised when you sell below average cost [5].
Value averaging, by contrast, can involve selling, because it incorporates rebalancing. Edleson's book also has a chapter on a compromise version with no selling [11].
The versions people use
| Version | What changes | Source |
|---|---|---|
| Classic DCA from income | A fixed amount each period, from money earned over time (from a salary, for example) | [3][8] |
| Phasing in an available sum | The money already exists but is invested in instalments. Vanguard has used the term "systematic implementation plan" [8] and points out the difference from classic DCA [3]. | [3][8] |
| Fixed-quantity buying | The same quantity each time. The average cost equals the arithmetic mean of the prices. | [15] |
| Value averaging | The position follows a preset value path. It buys more after falls and may sell after rises. | [11] |
| Purchases weighted towards dips | River says its "supercharged" option buys an extra amount (25% to 200%) when the price is about 1% below a 7 to 30 day moving average (platform source) | [17] |
| SmartDCA | An amount inversely proportional to price. A preprint that has not been peer reviewed. | [15] |
| Frequency | From hourly to monthly execution, depending on the platform | [12][17] |
Compared with the alternatives
| Approach | What it does | What it offers | What it trades away |
|---|---|---|---|
| Lump sum investment | The whole amount at once | Full exposure from day one | Full exposure to the entry moment and to regret |
| DCA | A fixed amount per interval | Entry spread over time, with no forecasts | Part of the money goes in later. More executions mean more cost. |
| Fixed-quantity buying | The same quantity per interval | Simple quantity planning | Average cost equal to the arithmetic mean, variable payments |
| Value averaging | A value target per period | Buys more on falls, provides for sales | Needs cash available when the price falls sharply, and is more complex |
| Discretionary buying on dips | Buying only after a fall | Purchases at lower prices than before | Long stretches can pass with no purchase. Relies on judgement. |
Platforms often promote comparisons that favour regular buying. eToro states that, in SPY, an ETF (exchange-traded fund) that tracks the S&P 500 index, buying after every fall of more than 5% in the index would have meant 16 investments, against 210 months of regular buying. According to the platform, regular buying performed "125% better" (platform source) [18]. The platform shows a hypothetical chart for 2007 to 2024 without describing the calculation in detail, and the claim concerns stocks, not crypto.
What the evidence says
Studies of traditional markets
The main research concerns stocks and bonds, not crypto. Its results do not automatically carry over to crypto.
| Study | Where published | What it examined | What it found (as stated) |
|---|---|---|---|
| Constantinides, 1979 [9] | Journal of Financial and Quantitative Analysis | Theoretical analysis | DCA is not an optimal investment policy |
| Knight and Mandell, 1992/93 [10] | Financial Services Review | Stock market, historical data and simulations | No benefit. Rebalancing and buy-and-hold did better. |
| Statman, 1995 [19] | Journal of Portfolio Management | Behavioural framework | Four behavioural explanations for DCA's popularity |
| Leggio and Lien, 2001 [19][20] | Financial Services Review | Empirical test of Statman | Loss aversion does not explain why DCA persists |
| Brennan, Li and Torous, 2005 [6][21] | Review of Finance | Purchases of individual stocks into an existing portfolio | The evidence supports DCA in this setting, linked to prices tending to revert to the mean |
| Vanguard (Shtekhman, Tasopoulos, Wimmer), 2012 [3] | Fund company research (platform source) | US 1926-2011, UK 1976-2011, Australia 1984-2011 | Lump sum came out ahead in about two thirds of periods |
| Cho and Kuvvet, 2015 [19] | Journal of Financial Planning | Mean-variance analysis | Depending on the investor's level of risk aversion, DCA can be optimal |
| Smith and Artigue, 2018 [6] | The Journal of Investing | Mean-variance analysis | An "imperfect, but helpful" way to spread investment decisions over time |
The Vanguard study in detail [3].
| Measure | Result |
|---|---|
| Design | One million in local currency. Lump sum or DCA over 6 to 36 months. Rolling ten-year periods. |
| Lump sum ahead, 60/40 portfolio | 67% (US), 67% (UK), 66% (Australia) |
| Lump sum ahead of 36-month DCA, US | About 90% of periods |
| Average ending value, US | 2,450,264 dollars (lump sum) against 2,395,824 dollars (DCA), a difference of 2.3% |
| 12-month periods with a loss in value, US (out of 1,021) | 22.4% with lump sum (average loss 84,001 dollars), 17.6% with DCA (average loss 56,947 dollars) |
| Transaction costs | Not included |
In crypto, we found no peer-reviewed study comparing DCA with lump sum investing. The only academic-format text we examined is the SmartDCA preprint [15]. That is why the bitcoin figures that follow are our own calculations.
Our bitcoin simulations
The backtest that follows is a hypothetical example (our calculation). A backtest simulates a strategy using historical prices. Bitcoin was chosen because it has the longest reliable price history. The choice is not a recommendation.
| Parameter | Choice |
|---|---|
| Price | Coin Metrics PriceUSD, the day's end-of-day UTC close, in US dollars, nominal prices [1][2] |
| DCA | 100 dollars every month, on the same day of the month as the start date |
| Lump sum | The same total amount on the start date |
| Valuation | Both strategies are valued on the same end date |
| Fee | 1% per purchase [16]. This is why every position starts with a 1% loss. |
| Spread and taxes | Not included |
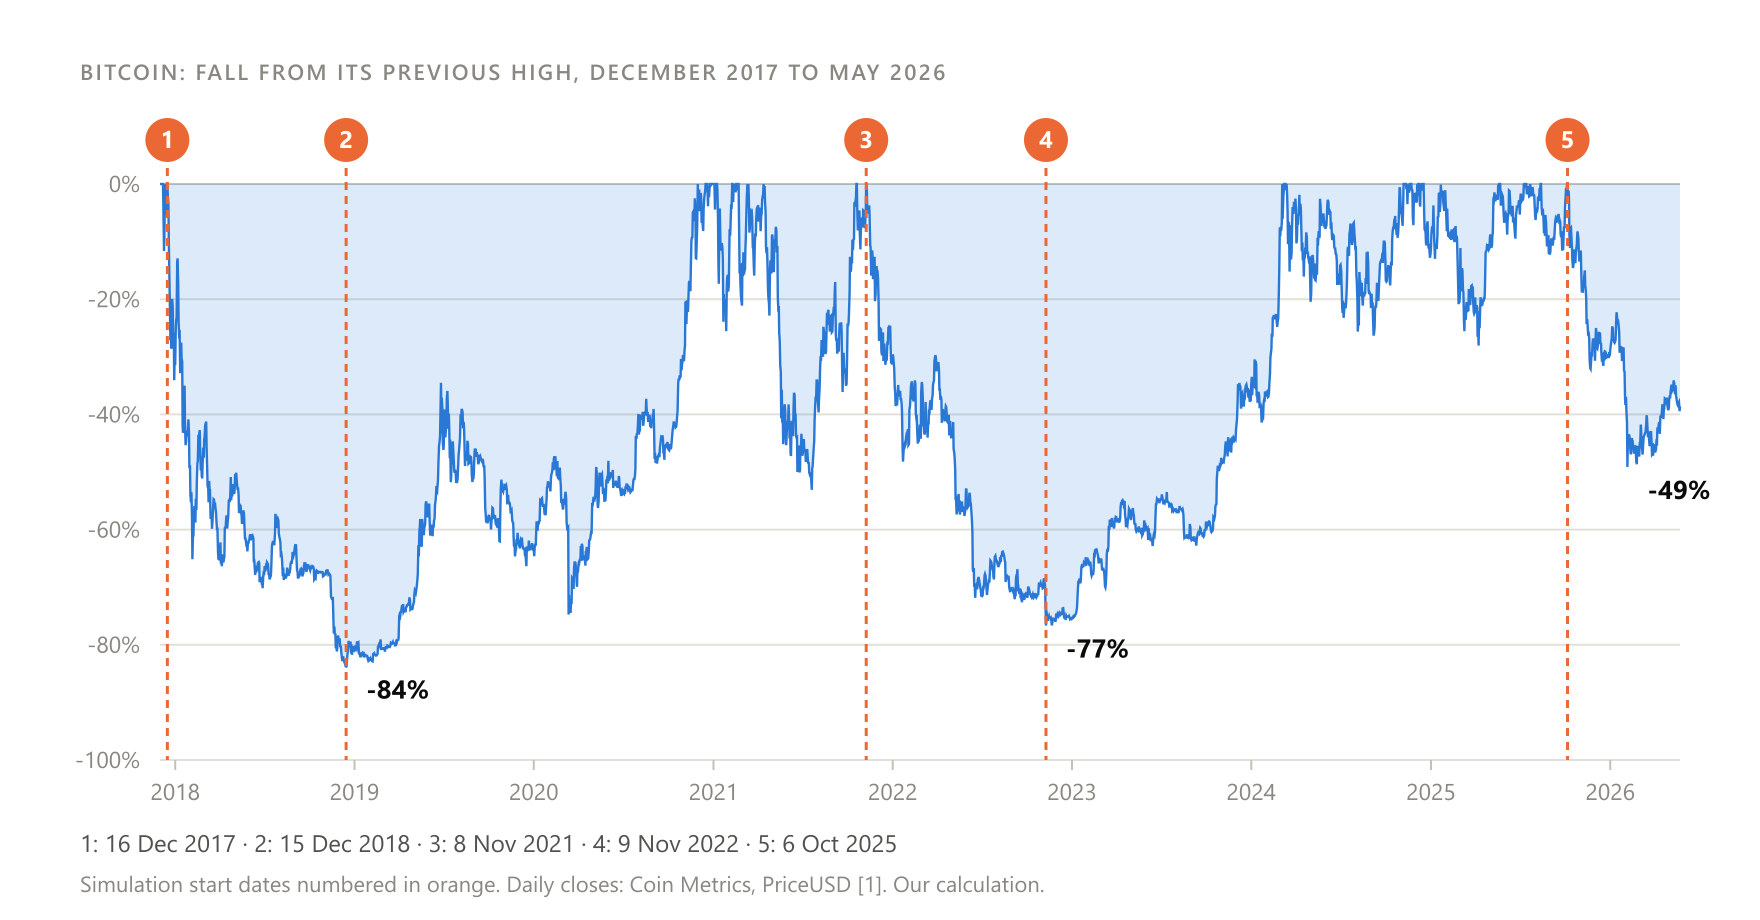
We chose five start dates:
| Date | Close (USD) | Why |
|---|---|---|
| 16 December 2017 | 19,640.51 | The highest close of late 2017 |
| 15 December 2018 | 3,185.07 | The lowest close between November 2018 and January 2019 |
| 8 November 2021 | 67,541.76 | The highest close of the last quarter of 2021 |
| 9 November 2022 | 15,758.29 | The lowest close between June 2022 and January 2023 |
| 6 October 2025 | 124,824.45 | The highest close between January 2025 and May 2026 |
There are two end dates: 31 December 2022, the end of a falling year, and 23 May 2026, the last available price.
Alongside every return we show three risk measures. The first is the maximum drawdown, the deepest fall in value from a previous high. For DCA it includes new contributions, so it shows a smaller fall than the money already invested experienced. The second is the worst point against invested, the lowest value relative to the amount invested up to that date. The third is the longest stretch below invested, the longest continuous period in which the position was worth less than the money put in.
For the lump sum we also show the compound annual growth rate (CAGR), only for periods longer than one year. DCA has no equivalent measure, because the money goes in gradually, so we do not show one.
DCA, 100 dollars a month (USD, our calculation)
| Period | Invested | Final value | Total return | Maximum drawdown | Worst point against invested | Longest stretch below invested |
|---|---|---|---|---|---|---|
| 16 December 2017 to 31 December 2022 | 6,100 | 9,462.00 | +55.1% | -74.9% | -59.2% | 509 days |
| 16 December 2017 to 23 May 2026 | 10,200 | 49,958.63 | +389.8% | -74.9% | -59.2% | 509 days |
| 15 December 2018 to 31 December 2022 | 4,900 | 6,898.94 | +40.8% | -74.1% | -20.0% | 7 days |
| 15 December 2018 to 23 May 2026 | 9,000 | 38,085.96 | +323.2% | -74.1% | -20.0% | 7 days |
| 8 November 2021 to 31 December 2022 | 1,400 | 811.84 | -42.0% | -37.1% | -54.6% | 277 days |
| 8 November 2021 to 23 May 2026 | 5,500 | 10,062.80 | +83.0% | -47.5% | -54.6% | 352 days |
| 9 November 2022 to 23 May 2026 | 4,300 | 7,244.99 | +68.5% | -46.8% | -1.0% | 1 day |
| 6 October 2025 to 23 May 2026 | 800 | 723.94 | -9.5% | -34.6% | -37.5% | 230 days (the whole period) |
Lump sum investment of the same total (USD, our calculation)
| Period | Invested | Final value | Total return | CAGR | Maximum drawdown | Worst point against invested | Longest stretch below invested |
|---|---|---|---|---|---|---|---|
| 16 December 2017 to 31 December 2022 | 6,100 | 5,080.81 | -16.7% | -3.6% | -83.8% | -83.9% | 1,096 days |
| 16 December 2017 to 23 May 2026 | 10,200 | 39,393.44 | +286.2% | +17.4% | -83.8% | -83.9% | 1,096 days |
| 15 December 2018 to 31 December 2022 | 4,900 | 25,167.07 | +413.6% | +49.9% | -76.7% | -1.0% | 2 days |
| 15 December 2018 to 23 May 2026 | 9,000 | 214,338.19 | +2,281.5% | +53.2% | -76.7% | -1.0% | 2 days |
| 8 November 2021 to 31 December 2022 | 1,400 | 339.09 | -75.8% | -71.0% | -76.7% | -76.9% | 419 days |
| 8 November 2021 to 23 May 2026 | 5,500 | 6,176.85 | +12.3% | +2.6% | -76.7% | -76.9% | 851 days |
| 9 November 2022 to 23 May 2026 | 4,300 | 20,698.36 | +381.4% | +56.0% | -49.1% | -1.0% | 1 day |
| 6 October 2025 to 23 May 2026 | 800 | 486.15 | -39.2% | Under one year | -49.1% | -49.6% | 230 days (the whole period) |
These results describe a past period and do not show what will happen in the future.
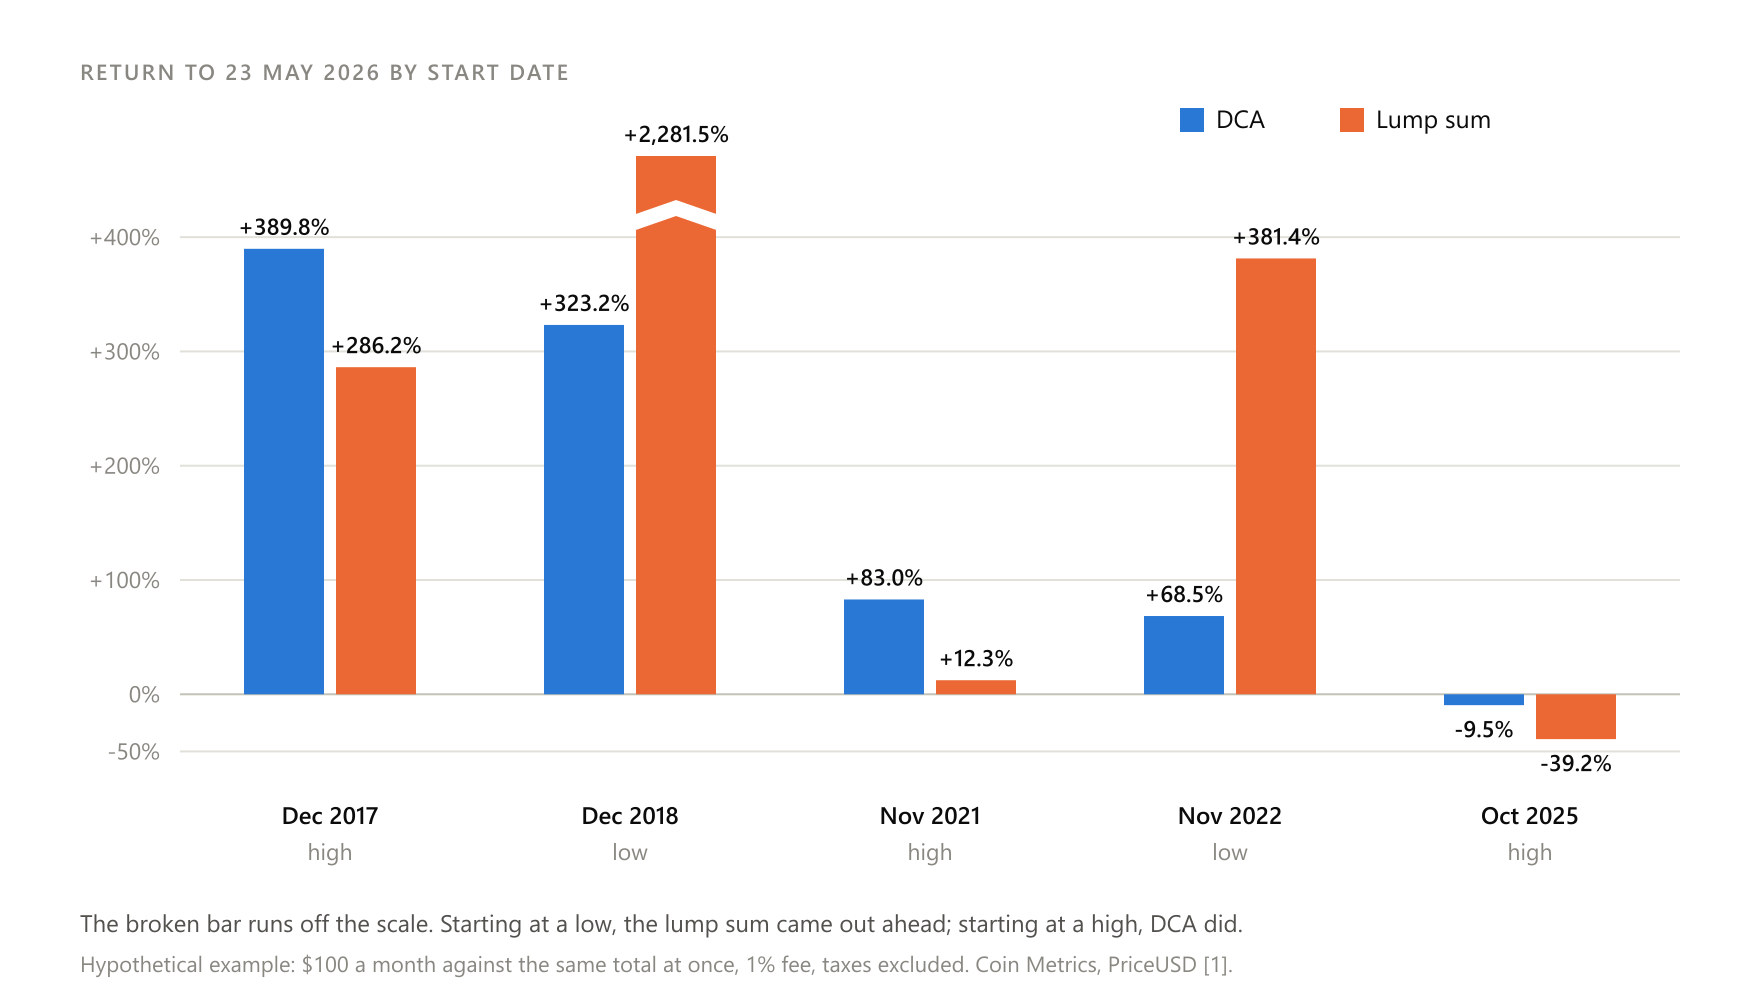
What the tables show. In the periods that start at a trough, the lump sum came out far ahead. In the periods that start at a peak, DCA came out ahead. From 6 October 2025, both strategies were at a loss on 23 May 2026, and neither was ever above the amount invested during that period.
This does not prove that one strategy is better than the other. It simply shows the mechanism: the lump sum wins when the price rises after entry, and DCA wins when it falls.
With no fee. If the fee were zero, the final value would be about 1% higher in every period for both strategies. For example, from 16 December 2017 to 23 May 2026, DCA returns +394.7% and the lump sum +290.1% (our calculation).
These results describe a past period and do not show what will happen in the future.
What the evidence cannot show. It does not show what bitcoin will do in the future. It says nothing about other coins: we chose a coin that survived, while many others did not. It ignores taxes, and it does not show what happens when the platform holding the money collapses.
The start date, the money waiting, and the exit
How much the start date matters
The table below puts all the start dates side by side, with a common end date of 23 May 2026. It includes the worst one (hypothetical example, our calculation).
| Start | Starting close (USD) | Point in the cycle | DCA return | Lump sum return | Came out ahead |
|---|---|---|---|---|---|
| 16 December 2017 | 19,640.51 | High | +389.8% | +286.2% | DCA |
| 15 December 2018 | 3,185.07 | Low | +323.2% | +2,281.5% | Lump sum |
| 8 November 2021 | 67,541.76 | High | +83.0% | +12.3% | DCA |
| 9 November 2022 | 15,758.29 | Low | +68.5% | +381.4% | Lump sum |
| 6 October 2025 | 124,824.45 | High | -9.5% | -39.2% | DCA (both at a loss) |
These results describe a past period and do not show what will happen in the future.
The gap between the best and worst rows comes from the date, not the strategy. DCA narrows that gap; it does not remove it.
The money waiting to be invested
When DCA comes from a salary, the money not yet invested is not "waiting": it simply has not been earned yet. But when someone already has a sum and invests it in instalments, the remainder waits somewhere, and that has a cost.
The first cost is opportunity cost. Vanguard calculates that, in the US data, a lump sum ended on average with 2.3% more value than 12-month DCA after ten years. This happened because stocks and bonds returned more than cash over the study period [3].
The second cost is counterparty risk, the risk that whoever holds the money fails. If the money waits on a platform, it depends on that platform. When Voyager Digital froze withdrawals in July 2022, it held 355.72 million dollars in customer cash [27].
If the money waits in a stablecoin (a cryptocurrency that aims to hold a fixed value, usually one dollar), there is the added risk of losing that fixed value.
Against lump sum
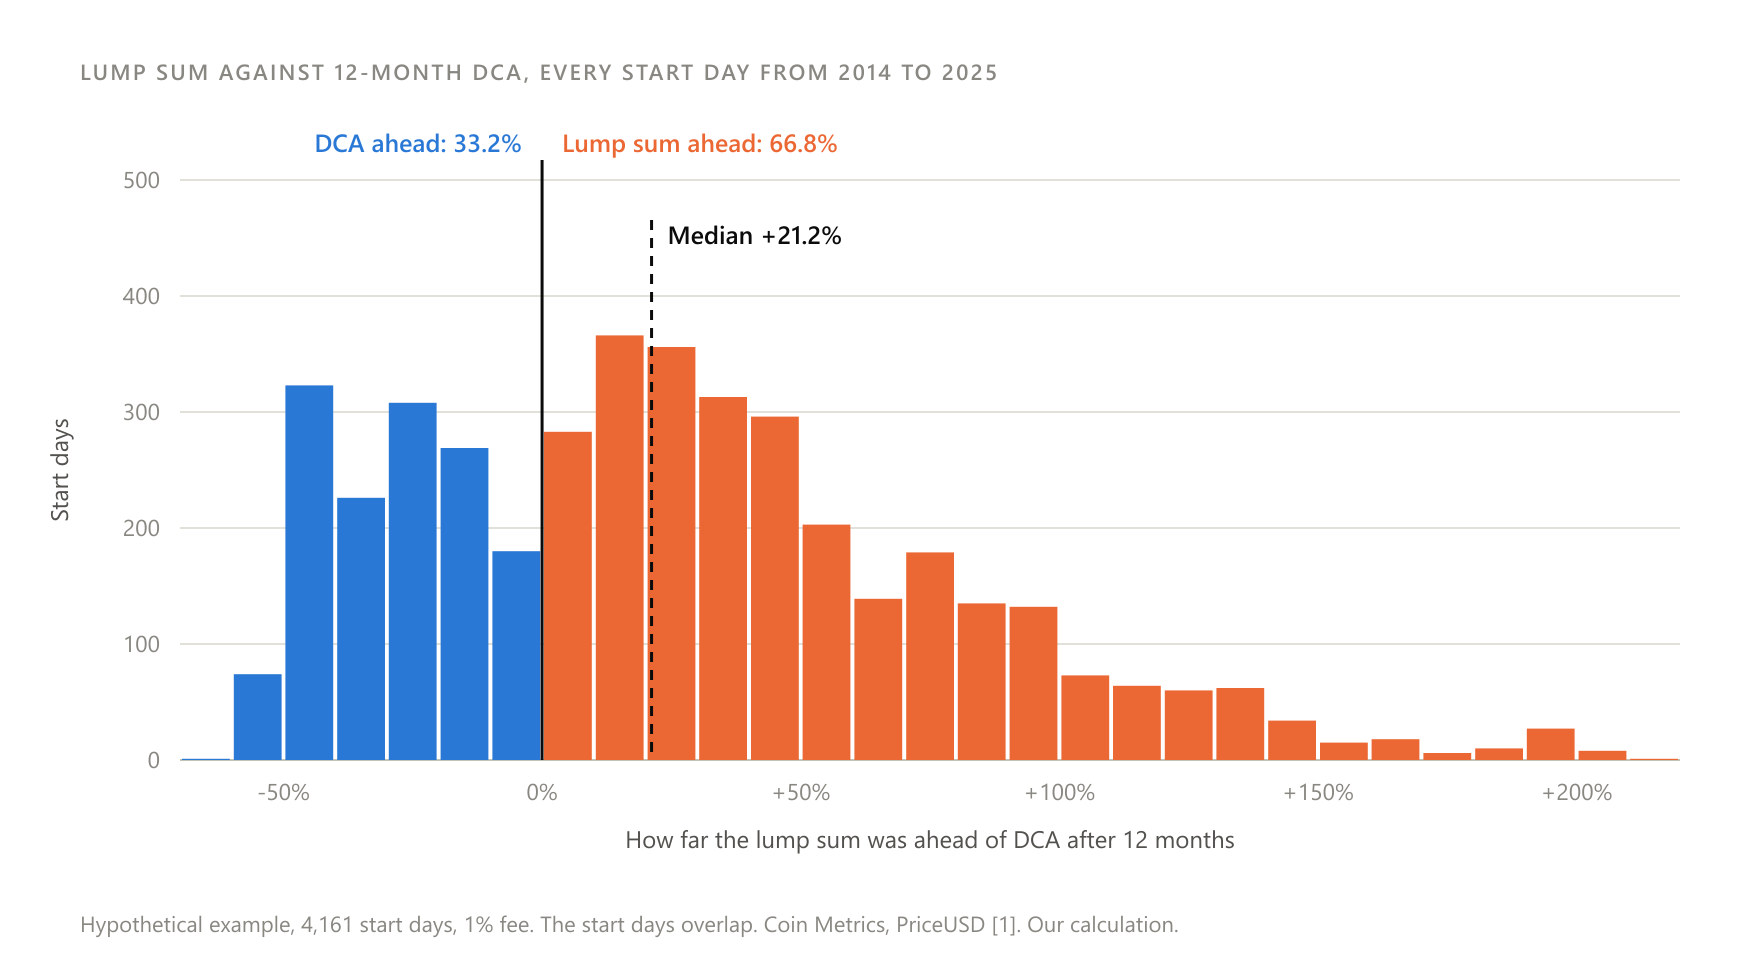
To see how often each approach came out ahead, we repeated the comparison for every start day from 1 January 2014. This is a hypothetical example (our calculation).
In each test, DCA buys 100 dollars of BTC a month for 12 months. The lump sum puts in 1,200 dollars on day one. Both pay a 1% fee and are valued at the same horizon, 12 or 36 months from the start.
| Horizon | Start days | Lump sum ahead | Median gap in favour of lump sum | Median gap when lump sum ahead | Median gap when DCA ahead | DCA below 1,200 dollars | Lump sum below 1,200 dollars |
|---|---|---|---|---|---|---|---|
| 12 months | 4,161 (1 January 2014 to 23 May 2025) | 66.8% | +21.2% | +43.1% | -26.9% | 29.1% | 30.3% |
| 36 months | 3,430 (1 January 2014 to 23 May 2023) | 61.5% | +19.0% | +49.4% | -28.5% | 2.5% | 0.5% |
The "gap" is the lump sum value divided by the DCA value, minus one.
These results describe a past period and do not show what will happen in the future.
In the data studied, the lump sum came out ahead on about two thirds of start days at the 12-month horizon. The share is close to what Vanguard found for stocks [3]. The reason is the same: as long as the price rose on average, money invested earlier had more time exposed to the rise.
When DCA came out ahead, the lump sum's median shortfall was about 27% at the 12-month horizon. On losses at 12 months, both approaches ended below 1,200 dollars on a similar share of start days.
There are two limitations. The start days overlap, so they are not independent tests. And this is a single coin.
The question it leaves open
DCA is an entry strategy. It says nothing about the exit.
All the valuations above are "on paper": they show what the position was worth on a given day, not what someone would have received by selling. If accumulation stops and the money is needed, the result is decided by the price on that day.
DCA spreads the entry over time. The exit, unless there is another rule, it leaves to happen all at once.
What it costs and what it trades away
Fees and spread. Every purchase carries a trading fee, stated outright or built into the price. With more, smaller purchases, the cost weighs more if the charge has a fixed component. Platforms publish their charges in very different ways, as the next section shows.
Waiting. When an available sum is invested in instalments, part of it stays out of the market. In Vanguard's data this cost 2.3% of ending value on average against a lump sum [3]. In our bitcoin data, the median gap was 21.2% at a 12-month horizon (our calculation).
Expected return. Vanguard notes that if someone expects the upward trend to continue, delaying the investment has a lower expected return [3]. This applies to phasing in a sum that already exists. It does not apply to DCA from a salary, where the alternative is to let cash pile up.
Time and discipline. The strategy requires continuing to buy while the position's value falls for months. In the period starting 16 December 2017, the DCA position was below the money invested for 509 consecutive days (our calculation).
How it is applied in practice
The selection criteria
DCA can be carried out with an automatic feature on a platform, or manually, with purchases on preset dates. Either way, a few criteria decide how much it costs and how safe it is.
Cost per execution and spread. One percentage point, multiplied by dozens of purchases a year, becomes a significant sum.
Transparency of the execution price. Platforms do not all disclose what they charge in the same way:
| Platform | What it publishes (checked 8 October 2026, platform source) |
|---|---|
| Coinbase | The fee is calculated when the order is placed and depends on payment method, size, market conditions and jurisdiction. Simple buys include a spread in the price. [22] |
| Kraken (app) | The fee for recurring buys appears on the final confirmation page [12] |
| River | Standard fee of 1% for orders up to one million dollars, zero for recurring buys from the seventh day after setup. The price "may include a spread". [23] |
| CoinJar (UK page) | 1% fee on recurring buys, minimum 10 pounds, maximum 1,000 pounds per transfer [16] |
| CoinEx | Auto-Invest charges only the normal spot trading fee, with a minimum of 1 USDT (a stablecoin) per cycle [24] |
Minimum amount and frequency options. These decide whether the plan fits the user's amount and schedule. The Kraken app, for example, offers daily, weekly, biweekly and monthly execution [12].
Supported assets. The feature has to cover the asset the user is interested in.
Withdrawal to your own wallet and its cost. A wallet is the software or device that holds the access keys. Coinbase, for example, charges a network transaction fee on withdrawals, based on its own estimate of the network cost [22].
Custody. Custody is the safekeeping of assets. In self-custody the user holds the keys themselves. If the platform holds the keys, it matters whether it publishes proof of reserves, that is, evidence that it holds its customers' assets.
Security record and company history. These show how the platform responded in difficult moments in the past.
How fees add up over a year (our calculation). Someone buys 100 dollars every week for 52 weeks, which is 5,200 dollars a year.
| Fee level | Cost over one year |
|---|---|
| 1% per purchase, like the fee on CoinJar's UK page [16] | 52 dollars |
| 1.5% per purchase (hypothetical level) | 78 dollars |
| 1% on the first purchase and zero on the rest, as River describes for weekly buys [23] | 1 dollar plus any spread built into the price |
The automatic feature is not mandatory. The same strategy can be applied manually, with purchases on preset dates, in which case the cost depends on the order type and the charges of the market used.
Setting it up safely
Access. Use only the official app or the official website. Check the address before you log in, because fake pages imitate real ones. Enable two-factor authentication.
Withdrawals. Where the option exists, enable a withdrawal address allowlist, so that money can only leave to addresses you have set.
Checks and records. At every execution, check the price you actually got and the fee you paid. Platforms state that the total cost can vary from purchase to purchase [12][22]. Keep a record of all purchases.
Self-custody. If you move the coins to your own wallet, store the recovery phrase offline. The recovery phrase is the sequence of words that restores the private key. Do not share it with anyone.
What it protects against and what it does not
What the security measures protect against. Two-factor authentication and an address allowlist reduce the risk of account takeover. Checking the address reduces the risk from impersonation and phishing (attempts to trick you into revealing your login details).
What they do not protect against. None of these measures protects against platform insolvency or a withdrawal freeze. Whatever stays on the platform depends on the platform. Self-custody removes that risk, but shifts responsibility for the keys to the user.
The behaviour behind the strategy
If academics consider it suboptimal, why has the strategy survived for more than 70 years? In 1995 Meir Statman proposed four behavioural explanations: people's tendency to give less weight to outcomes that are merely probable than to outcomes that are certain, the avoidance of responsibility and regret, cognitive errors caused by recent price trends, and a lack of self-control [19].
In a 2015 text Statman explains that DCA is a "non-contingent" plan: the decision has been made in advance. It therefore reduces the sense of responsibility, and with it the regret if the market falls [7]. The text was published on the blog of Wealthfront, which offers investment services.
Leggio and Lien tested the behavioural argument empirically in 2001. They found that loss aversion is not enough to explain why DCA persists, and their findings contradict Statman [19][20].
Vanguard accepts that concern about worst-case scenarios and regret is "not unreasonable" for risk-averse investors [3]. Schwab argues that DCA helps against loss aversion and against being "anchored" to an old price (platform source) [4].
The strategy protects against one specific mistake: putting the whole amount in on the worst day. It does not protect against panic selling, against abandoning the plan when the position has been at a loss for months, or against choosing the wrong coin.
On why investors abandon gradual buying plans, we found no research that meets our criteria. The question remains open.
When it has gone wrong
The cases below are not failures of the strategy itself. They are failures of the place where the money and coins of people buying gradually were kept. They are listed in date order.
Celsius, June 2022
On 12 June 2022 the lending platform Celsius announced it was pausing all withdrawals, swaps and transfers between accounts, citing "extreme market conditions" [25][26].
According to the company, the aim was to put itself in a better position to honour its withdrawal obligations "over time" [26]. According to the Financial Times, as reported by The Block, Celsius had about 12 billion dollars in customer assets and 1.7 million users in May [25].
The sources we used do not cover the current state of the customer compensation process. For that reason we do not know it and do not describe it.
Voyager Digital, July 2022
On 1 July 2022, at 2 p.m. US Eastern time, Voyager Digital suspended trading, deposits, withdrawals and its loyalty rewards programme [27]. Days earlier it had sent a notice of default to the investment fund Three Arrows Capital over a 650-million-dollar loan in BTC and USDC [27].
On 5 July 2022 it filed for bankruptcy under Chapter 11 of the US bankruptcy code [28].
One customer told Axios he "didn't think recurring eth purchases were at risk". He added that two of his deposits went through after withdrawals had already been shut down [29].
According to a report citing the plan administrator's status reports to the court (verified 13 August 2026), creditors who received both distributions have recovered 70% of their allowed claims. That share refers to the claim valued in dollars as of the bankruptcy filing date, 5 July 2022, not to the quantity of coins the customer held [28]. The report of 27 February 2026 expected a further distribution in 2026, with no percentage or date [28]. No outcome has been reported for a third distribution.
FTX, November 2022
The FTX exchange collapsed and filed for bankruptcy in November 2022 [30]. Distributions to creditors are made in rounds through the FTX Recovery Trust:
| Round | Date | Amount and recovery rates (cumulative) | Source |
|---|---|---|---|
| Third | September 2025 | About 1.6 billion dollars. Customers of the international exchange 78%, US customers 95%. | Blockworks [31] |
| Fourth | 31 March 2026 | About 2.2 billion dollars. Several customer classes reach 100%. | TheStreet [30] |
According to TheStreet, all payments are made in US dollars [30]. The percentages refer to the value of the claims as recognised in the process. The sources we used do not specify the price date behind that value, so we draw no conclusion about how many coins these percentages correspond to.
In May 2026 it was announced that the next round would start on 31 July 2026 [32]. The process continues, and no outcome has been reported for further distributions.
Common misconceptions
"A lower average cost means a better result." With a fixed amount, the average cost is always at most equal to the average of the prices, for purely mathematical reasons [15]. That says nothing about whether there will be a profit. In the 2022 example, the average cost fell to 26,676.86 dollars and the position ended the year with a 38.1% loss. In the periods that start at a trough, the lump sum bought at a single price, lower than DCA's average cost, and came out far ahead (our calculation).
"DCA protects against losses." It does not. Vanguard says so explicitly in its study [3], and so does Schwab [4]. From the 2021 peak to the end of 2022, DCA lost 42.0%. From the 2025 peak to 23 May 2026, it lost 9.5% (our calculation).
"DCA earns more than a lump sum." In the studies of stocks, the lump sum came out ahead in about two thirds of periods [3]. In bitcoin, it did so on 66.8% of start days at a 12-month horizon (our calculation).
"DCA from a salary and phasing in a sum are the same thing." They are not. Vanguard points out the confusion: its research concerns sums that already exist. For purchases from current income, DCA is essentially the only alternative to building up cash for later market timing [3][8].
"DCA is a complete plan." The strategy sets only the amount and the frequency [8]. It does not set the coin, the duration or the exit.
"Small purchases in an app are safe because they are small." The size of a purchase does not change the platform's risk. In the Voyager case, a customer making recurring purchases said two of his deposits went through after withdrawals had been frozen [29].
"Platform examples show DCA's advantage." Schwab's example shows a price that falls from 5 to 2 dollars and returns to 5. With DCA the investor ends with 135 shares against 100 with a single purchase [4]. The result comes from the price path chosen for the example. If the price had risen steadily, the opposite would have happened.
The open questions
The case that DCA is simply a worse policy. Constantinides in 1979 [9] and Knight and Mandell in 1992/93 [10] argue that DCA falls short of other policies and offers no real benefit. The argument at full strength: anyone who wants less risk can immediately invest a smaller share, instead of temporarily holding more cash than they would want.
The case that it is a reasonable compromise. Cho and Kuvvet [19] and Smith and Artigue [6] respond that the strategy spreads risk over time. Depending on the level of risk aversion, it can be optimal. The question stays open because the answer depends on how risk is defined.
Whether the defence from stocks carries over to crypto. Brennan, Li and Torous support DCA for individual stocks, linked to prices tending to revert to their mean [6][21]. We found no peer-reviewed study testing whether the same mechanism applies in crypto.
How much weight the strategy itself carries. Our view at CRYPTONEA 24 is that, in the simulations, the choice of coin and the start date matter far more than the entry method. Bitcoin is a coin that survived. An analysis of coins that lost almost all their value would show that DCA merely spreads a loss over time.
The risks for the reader
The coin. The most important risk is not the method but the asset. If its value is lost, gradual buying does not change that.
The platform. Automatic purchases usually leave the coins and the cash on a platform. As Celsius and Voyager showed, a withdrawal freeze can lock up both for years [25][27].
The cost. With frequent small purchases, fees and spreads can be high, and they are not always visible before execution [12][22].
The duration. The investor can stay at a loss for a long time. In our simulations, up to 509 days for DCA and 1,096 days for the lump sum (our calculation).
The exit. The strategy has no exit rule. If the money is needed at a bad moment, the sale will happen at that moment's price.
Taxes and rules. The tax treatment of each purchase and sale differs from country to country. Rules affecting crypto and platforms can change.
Sources
- P: Coin Metrics, Community Data: btc.csv (PriceUSD), github.com/coinmetrics/data, May 2026
- P: Coin Metrics, Price (PriceUSD), docs.coinmetrics.io/network-data/network-data-overview/market/price, October 2026
- P: Shtekhman, Tasopoulos, Wimmer (Vanguard), Dollar-cost averaging just means taking risk later, static.twentyoverten.com (copy), July 2012 (platform source)
- P: Charles Schwab, What Is Dollar-Cost Averaging?, schwab.com/learn, March 2026 (platform source)
- P: The Black Mountain News, How Americans Invest on a Budget, newspapers.digitalnc.org, February 1960 (platform source)
- P: Smith, Artigue, Another Look at Dollar Cost Averaging, The Journal of Investing 27(2), scholarship.claremont.edu/pomona_fac_econ/19, 2018
- S: Statman, Dollar Cost Averaging: A Behavioral View, wealthfront.com/blog, June 2015 (platform source)
- S: Wikipedia, Dollar-cost averaging, en.wikipedia.org, October 2026
- P: Constantinides, A Note on the Suboptimality of Dollar-Cost Averaging as an Investment Policy, Journal of Financial and Quantitative Analysis 14(2), cambridge.org, June 1979
- P: Knight, Mandell, Nobody Gains from Dollar Cost Averaging: Analytical, Numerical and Empirical Results, Financial Services Review 2(1), ojs01.galib.uga.edu/fsr, 1992/93
- P: Edleson, Value Averaging (Wiley Investment Classics), download.e-bookshelf.de, October 2006
- P: Kraken, Recurring Orders on the Kraken App, support.kraken.com, July 2026 (platform source)
- P: Funston (New York Stock Exchange), Management Looks at Corporate Ownership, sechistorical.org, May 1954 (platform source)
- S: Traflet, A Nation of Small Shareholders, press.jhu.edu, 2013
- P: Calvet, Herranz-Celotti, Valimamode, SmartDCA superiority, arxiv.org/abs/2308.05200, August 2023
- P: CoinJar, Recurring Buy (CoinJar Support UK), support.coinjar.com/hc/en-gb, February 2026 (platform source)
- P: River, What are supercharged recurring buys?, support.river.com/hc/en-us, May 2026 (platform source)
- P: eToro, Automate your goals with Recurring investments, etoro.com/investing/recurring, October 2026 (platform source)
- P: Cho, Kuvvet, Dollar-Cost Averaging: The Trade-Off Between Risk and Return, Journal of Financial Planning 28(10), financialplanningassociation.org, October 2015
- P: Leggio, Lien, Does Loss Aversion Explain Dollar-Cost Averaging?, Financial Services Review 10, openjournals.libs.uga.edu/fsr, 2001
- P: Brennan, Li, Torous, Dollar Cost Averaging, UCLA eScholarship, escholarship.org/uc/item/53p0r65q, 2005
- P: Coinbase, Coinbase pricing and fees disclosures: crypto, help.coinbase.com, October 2026 (platform source)
- P: River, What are River's fees?, support.river.com/hc/en-us, August 2026 (platform source)
- P: CoinEx, Auto-Invest Plan: Basic Concepts, coinex.com/en/help, October 2026 (platform source)
- S: The Block, Crypto lending firm Celsius pauses withdrawals and transfers, citing market conditions, theblock.co, June 2022
- S: Blockworks, Celsius Lending Platform Suspends Withdrawals and Transfers, blockworks.com, June 2022
- S: The Block, Voyager Digital suspends withdrawals, deposits and trading, theblock.co, July 2022
- S: Boxmining, Voyager Digital Bankruptcy Update 2026: Recovery Status, boxmining.com, August 2026
- S: Axios, Voyager Digital customers feeling the pain, axios.com, July 2022
- S: TheStreet (Yahoo Finance), Bankrupt crypto exchange to repay $2.2B on March 31, finance.yahoo.com, March 2026
- S: Blockworks, FTX Recovery Trust to distribute ~$1.6B in September payout, blockworks.com, September 2025
- S: Crypto Briefing (cryptonews.net), FTX recovery trust targets July 31 for next round of creditor payments, cryptonews.net, May 2026
This article is educational and for general information. It is not investment or financial advice and does not take your personal circumstances into account. Examples and simulations describe the past and do not predict future returns. Investing in crypto can lead to the loss of all the money invested. The facts in crypto move quickly, so verify them before you act on anything here.