
The RSI (Relative Strength Index) measures, on a scale from 0 to 100, how large recent upward price moves have been compared with downward ones.
The problem it addresses is old and hard. A 2,000 dollar rise in Bitcoin and a 2 dollar rise in a smaller cryptocurrency are not easy to compare. Nor is it obvious when a run of up days is "a lot" and when it is ordinary.
This article covers where the indicator came from, how it is calculated with real numbers, which settings change it, and how traders read it. It also covers what research found and what our own historical tests on Bitcoin showed, together with the cases where the readings went wrong.
This article is informational. It is not investment advice or a signal to buy or sell, and every example in it describes the past.
The problem it tries to solve
Before 1978, anyone who wanted to measure the "strength" of a move used various oscillators (indicators that swing up and down around a centre). The problem was that each oscillator had its own scale. The RSI put all commodities and stocks on the same scale, as its creator later explained [1].
The indicator belongs to the momentum family (indicators of how forcefully price is moving). It measures the speed and size of price changes, and it should not be confused with "relative strength" in the sense of comparing two different assets [2]. The RSI compares a price only with its own past.
Where the indicator came from
The indicator was published in 1978 in J. Welles Wilder's book New Concepts in Technical Trading Systems, issued by Trend Research in Greensboro, North Carolina, in 141 pages [3]. It also appeared in an article in the June 1978 issue of Commodities magazine [1][2].
Wilder was born in Norris, Tennessee [4]. He served in the Navy, studied mechanical engineering at North Carolina State, worked as an engineer and then as a residential developer. From 1999 he lived permanently in New Zealand [1]. In the same book he introduced Directional Movement, the Parabolic SAR, the Commodity Selection Index, the Swing Index and the Volatility Index [5][1].
The indicator was designed for commodity futures markets and for daily candles (the unit of time on the chart, here one day). The terms used in the book include "DAILY WORK SHEET", "failure swing" and "14 days" [5]. That fits the picture of a calculation done by hand, day by day. The interpretation is ours, and only the book itself can confirm it.
The indicator predates Bitcoin by three decades. It reached crypto charts as a ready-made tool in charting software. Wilder himself described how that journey began: in 1978 small computers were just appearing and, as he put it, every trader was looking for something to program [1].
The engineer who could not remember how he built it
What follows comes from an interview with Wilder himself [1]. When his partners bought his share of 1,035 apartments, he found himself at 38 with all the money he needed and nothing to do, so he began to study commodity trading.
He made money in silver, lost money in other commodities, stopped, and turned to technical analysis in the early to mid 1970s. For a small fee, a collector in Minnesota who had gathered almost everything in print on technical analysis mailed him writings to copy and send back.
He self-published the book, ran a full-page advertisement and an article on the RSI in Commodities in June 1978, and says he sold more than 25,000 copies at 65 dollars. The sales figure is his own claim. We did not verify it. He named his ability to write advertising copy as the biggest factor in his success.
Decades later he was asked how exactly he had designed the RSI. He answered: "Frankly, I can't remember exactly how I did it." [1]
That is what the documents show. What follows is our reading. The indicator that today appears on almost every platform was not born in a university or a bank. It came from a self-taught researcher who knew how to sell his ideas, at the moment when the first personal computers were looking for formulas to run. Its spread says a lot about how easy it is to compute. It says much less about whether it helps the people who use it. Only data can answer that question.
How it works, from zero
Picture a referee keeping notes during a football match. On every play he writes down how many metres one team gained and how many the other did. To say "who is pressing now", he does not add up the whole match. He looks mostly at recent plays, while older ones slowly fade from his mind.
The RSI does the same with the closing price (the last price of each candle). Every day that closes higher than the day before counts as "metres" for buyers. Every day that closes lower counts as "metres" for sellers. The indicator keeps a moving average for each side and turns their relationship into a number from 0 to 100. A value near 100 means rises dominated recently. A value near 0 means falls dominated. 50 means balance.
The analogy breaks down in three places. The referee knows why a team gained ground, while the RSI knows nothing about news, trading volume or causes. The referee sees the whole play, while the RSI sees only where each candle closed and ignores intraday highs and dips. And the referee does not predict the next goal. Neither does the RSI.
The calculation, step by step
The formula, as described by the sources that trace back to Wilder [2][6], is as follows.
RSI = 100 − 100 / (1 + RS)
RS is the average of the rises divided by the average of the falls. A day's rise (U) is the increase in the closing price compared with the previous close, otherwise zero. A fall (D) is the decrease in absolute terms, otherwise zero [2]. The terms "average UP close", "average DOWN close" and "previous close" also appear in the book itself [5].
The first average is a simple 14-day average. From then on, Wilder's smoothing applies (the way the new average "remembers" the old one) [2]:
new average = (previous average × 13 + today's value) / 14
It follows from the formula that this smoothing is equivalent to exponential smoothing with a factor of 1/14. It also follows that if the average of the falls is zero, the RSI is 100, and if the two averages are equal, the RSI is 50. The TA-Lib library, which we used as a check, returned exactly the same results as this formula (our calculation).
Hypothetical example: Bitcoin, June 2022
The data is Coin Metrics' daily Bitcoin price in dollars (PriceUSD). The price refers to the end of each day in UTC and is computed from the CM Reference Rates [7]. It was downloaded on 8 October 2026 from the company's public archive [8].
This is a reference price drawn from a set of selected markets, not the price of a single exchange. The daily value comes from a 61-minute window before midnight UTC: a volume-weighted median is calculated for each minute, and then a time-weighted average [9]. Coin Metrics states that it may occasionally revise limited portions of reference-rate history [9].
First, take 15 closing prices, from 4 to 18 June 2022. Then, for each day, calculate the change and split it into a rise or a fall.
| Date (end of day UTC) | Closing price ($) | Change | Rise U | Fall D |
|---|---|---|---|---|
| 4 June 2022 | 29,792.41 | |||
| 5 June 2022 | 29,915.41 | +123.00 | 123.00 | 0 |
| 6 June 2022 | 31,333.68 | +1,418.27 | 1,418.27 | 0 |
| 7 June 2022 | 31,175.03 | -158.64 | 0 | 158.64 |
| 8 June 2022 | 30,228.46 | -946.57 | 0 | 946.57 |
| 9 June 2022 | 30,064.49 | -163.98 | 0 | 163.98 |
| 10 June 2022 | 29,070.40 | -994.09 | 0 | 994.09 |
| 11 June 2022 | 28,360.79 | -709.61 | 0 | 709.61 |
| 12 June 2022 | 26,830.28 | -1,530.51 | 0 | 1,530.51 |
| 13 June 2022 | 22,316.26 | -4,514.03 | 0 | 4,514.03 |
| 14 June 2022 | 22,072.87 | -243.39 | 0 | 243.39 |
| 15 June 2022 | 22,520.79 | +447.92 | 447.92 | 0 |
| 16 June 2022 | 20,310.18 | -2,210.61 | 0 | 2,210.61 |
| 17 June 2022 | 20,464.93 | +154.75 | 154.75 | 0 |
| 18 June 2022 | 19,013.87 | -1,451.06 | 0 | 1,451.06 |
The rises add up to 2,143.95 and the falls to 12,922.49. Dividing by 14 gives an average rise of 153.14 and an average fall of 923.03. RS is 0.1659 and the RSI comes out at 14.23 (our calculation).
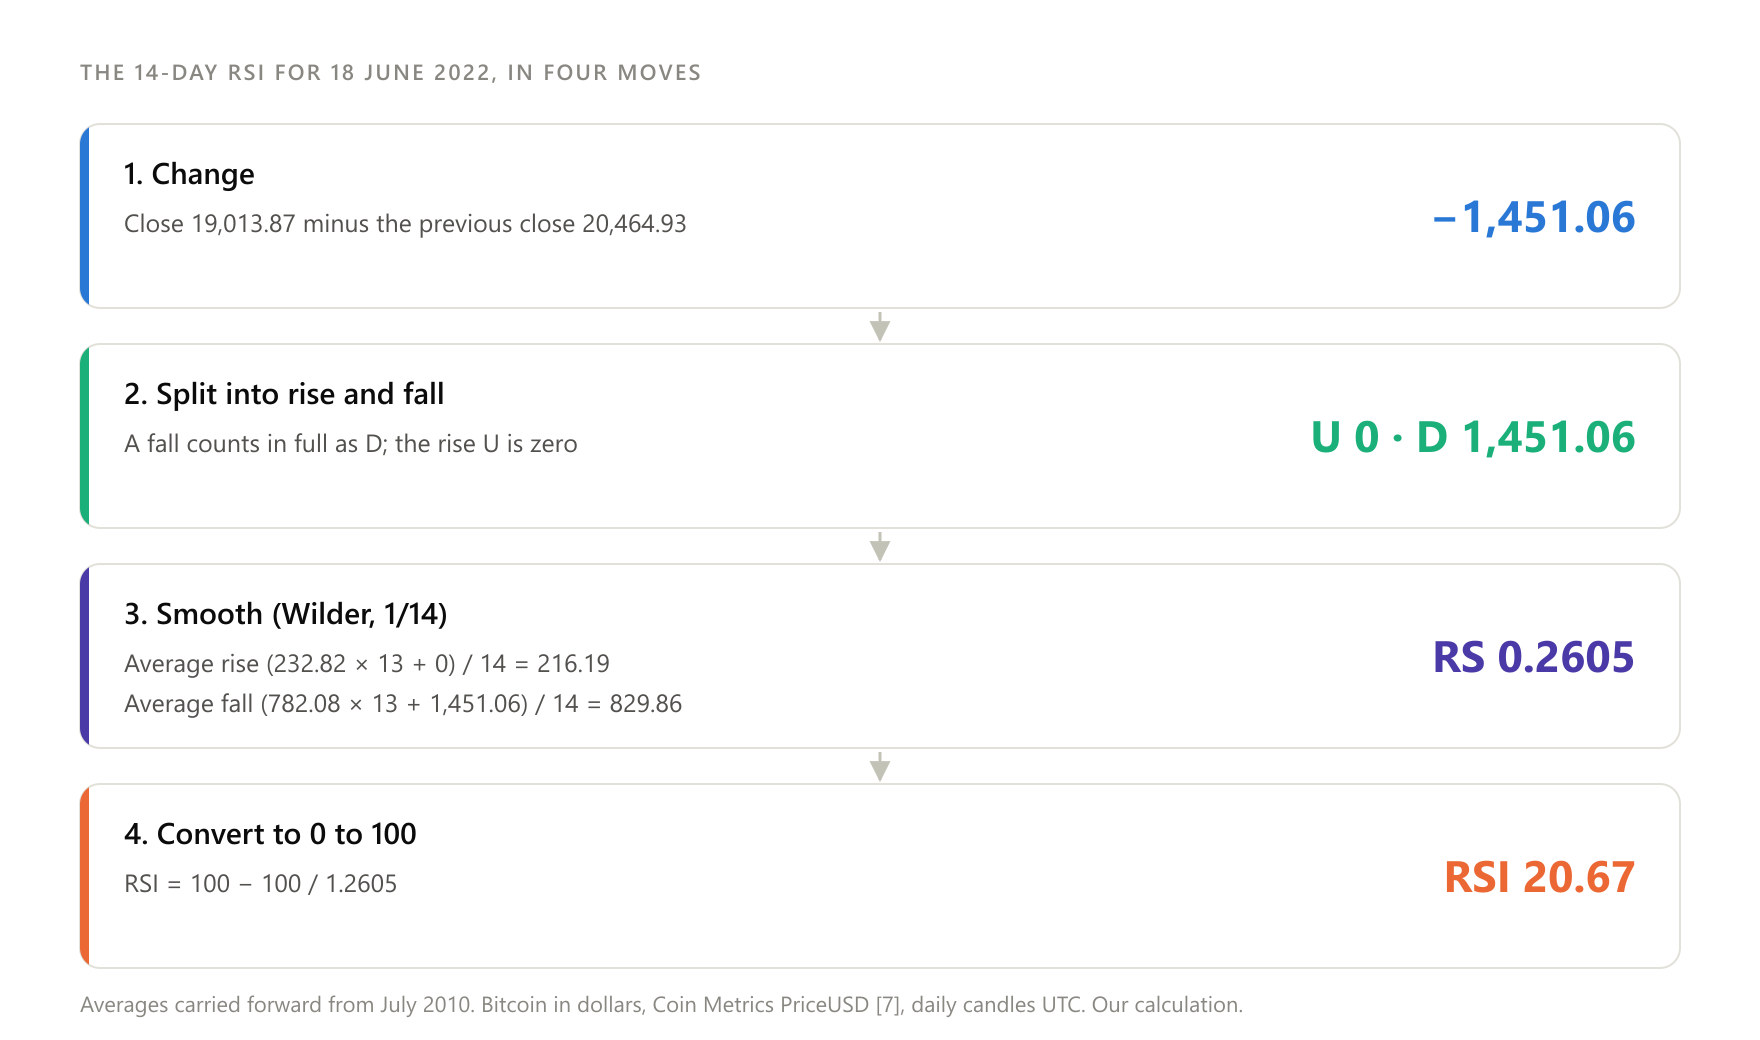
If you open a chart with full history, though, you will see a value close to 20.67 for the same day, not 14.23. The difference is not a mistake. It comes from the smoothing. When the calculation starts in 2010 and moves forward day by day, on 17 June 2022 the smoothed averages are 232.82 for rises and 782.08 for falls.
On 18 June the price fell by 1,451.06. The new average rise becomes (232.82 × 13 + 0) / 14 = 216.19. The new average fall becomes (782.08 × 13 + 1,451.06) / 14 = 829.86. Then RS = 0.2605 and RSI = 100 − 100 / 1.2605 = 20.67 (our calculation).
Why it needs a "warm-up"
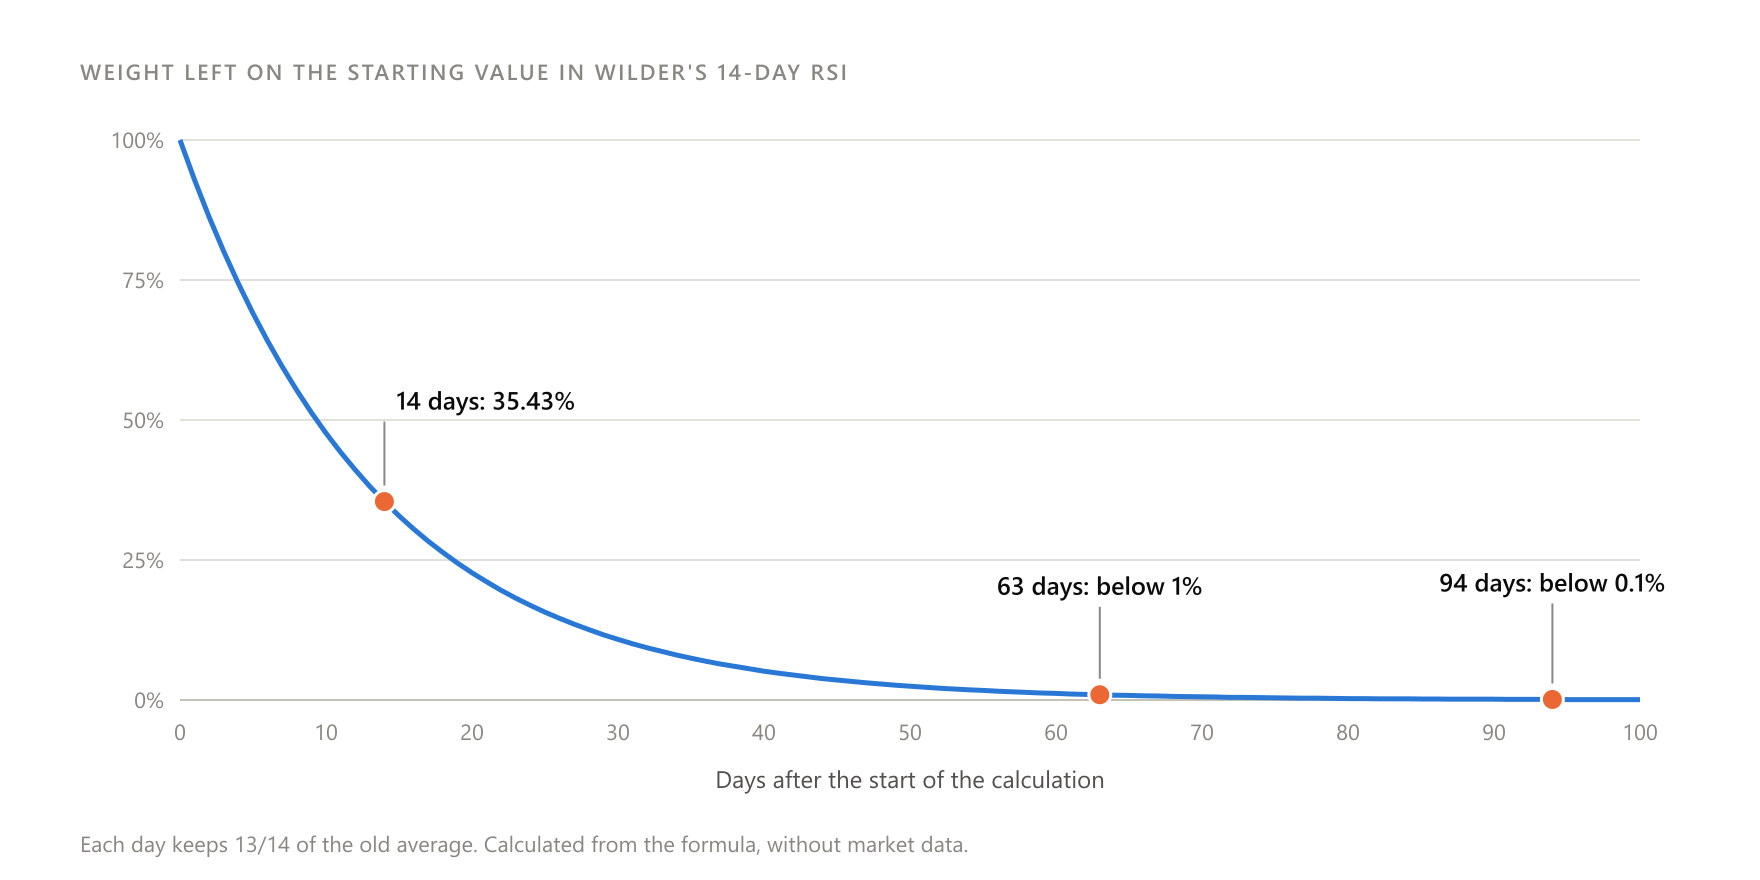
Each new day keeps 13/14 of the old average. So the starting value never disappears completely; it only fades. TA-Lib explains that indicators with "memory", such as the RSI, depend on a starting value whose effect shrinks with each new candle. It lists the RSI among functions with an "unstable period" [10].
| Days after the start | Weight left on the starting value |
|---|---|
| 14 | 35.43% |
| 28 | 12.56% |
| 50 | 2.46% |
| 63 | 0.94% |
| 100 | 0.06% |
The weight falls below 1% after 63 days and below 0.1% after 94 (our calculation). In the same hypothetical example, if the calculation starts 15 days before 18 June 2022, the RSI comes out at 14.85. Starting 30 days before gives 20.56, 63 days gives 20.66, and full history gives 20.67 (our calculation).
Checking the result
We ran the same data through the open-source TA-Lib library (version 0.8.1). For 18 June 2022 it returned 20.6673, differing from our own calculation by less than one trillionth.
A charting platform will show a somewhat different number for the same day. It usually uses the last price on one specific exchange, not a reference price computed over a 61-minute window [9]. The closing time of the daily candle can also differ. And, according to TA-Lib, most charting sites ignore the warm-up issue altogether [10].
The settings that change the result
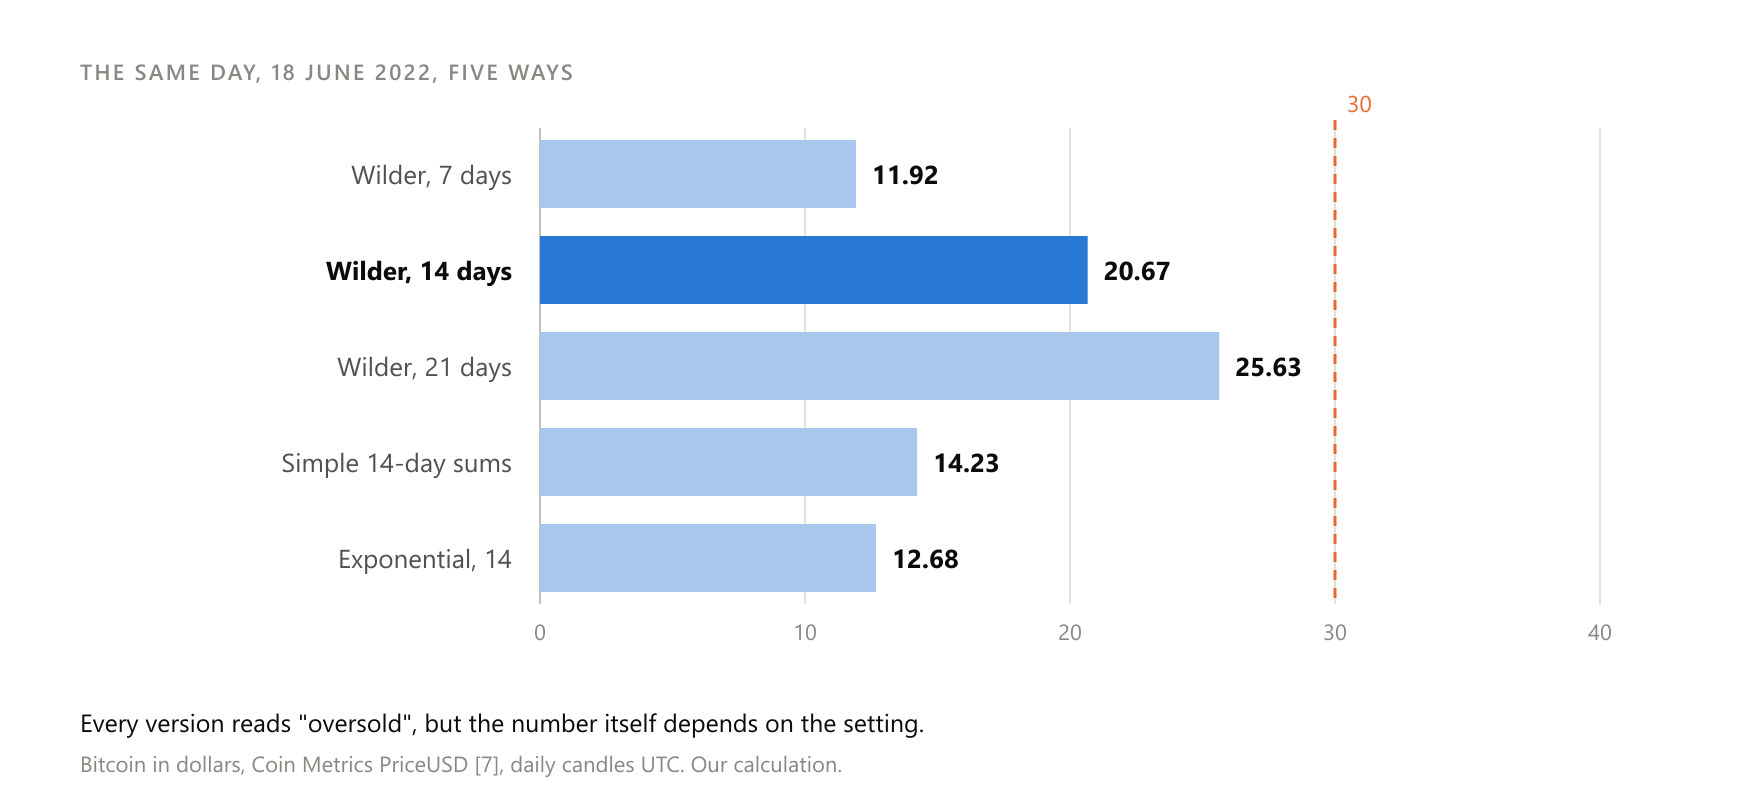
The period is the number of candles the indicator "remembers". Wilder proposed 14 [2][11]. A shorter period makes the indicator jumpier; a longer one makes it calmer. In the same hypothetical example, for 18 June 2022, the 7-day RSI was 11.92, the 14-day RSI 20.67 and the 21-day RSI 25.63 (our calculation).
The smoothing method also changes the number. Some programs use an ordinary exponential moving average instead of Wilder's smoothing [2]. With a 14-period exponential average (factor 2/15), the RSI for 18 June 2022 comes out at 12.68. With simple 14-day sums it comes out at 14.23 (our calculation).
The 70 and 30 thresholds are not a law. Fidelity writes that they can be adjusted, for example to 80 for a security that repeatedly touches 70, and that in strong trends the indicator can stay at extreme values for long periods [6] (platform source).
Crypto adds its own complications. The market never closes, so the "daily close" is a convention. The data in this article closes at the end of the day UTC. A chart set to Greek or New York time splits the days elsewhere, so it gives different closing prices and a different RSI. Coin Metrics, for example, also publishes a daily frequency that closes at 16:00 New York time [9]. In addition, every exchange has its own price. A reference price drawn from many markets smooths out those differences [9].
How traders read it
In this section we keep apart what Wilder himself wrote and what others added later. Wilder said the reading rules are laid out in detail on page 68 of his book, and he singled out the "failure swing" as one of the most important concepts [1]. The book was not available for direct checking, so we describe his rules as secondary sources record them.
All the dates and prices that follow are hypothetical examples from our tests: Bitcoin prices in dollars, Coin Metrics PriceUSD, daily candles UTC, after a 0.10% fee and 0.05% slippage per trade.
The 70 and 30 zones (Wilder)
Wilder held that tops and bottoms form above 70 and below 30 [2][11]. The area above 70 is called the overbought zone and the area below 30 the oversold zone. A common way of using them is to watch for the indicator moving back above 30 and back below 70.
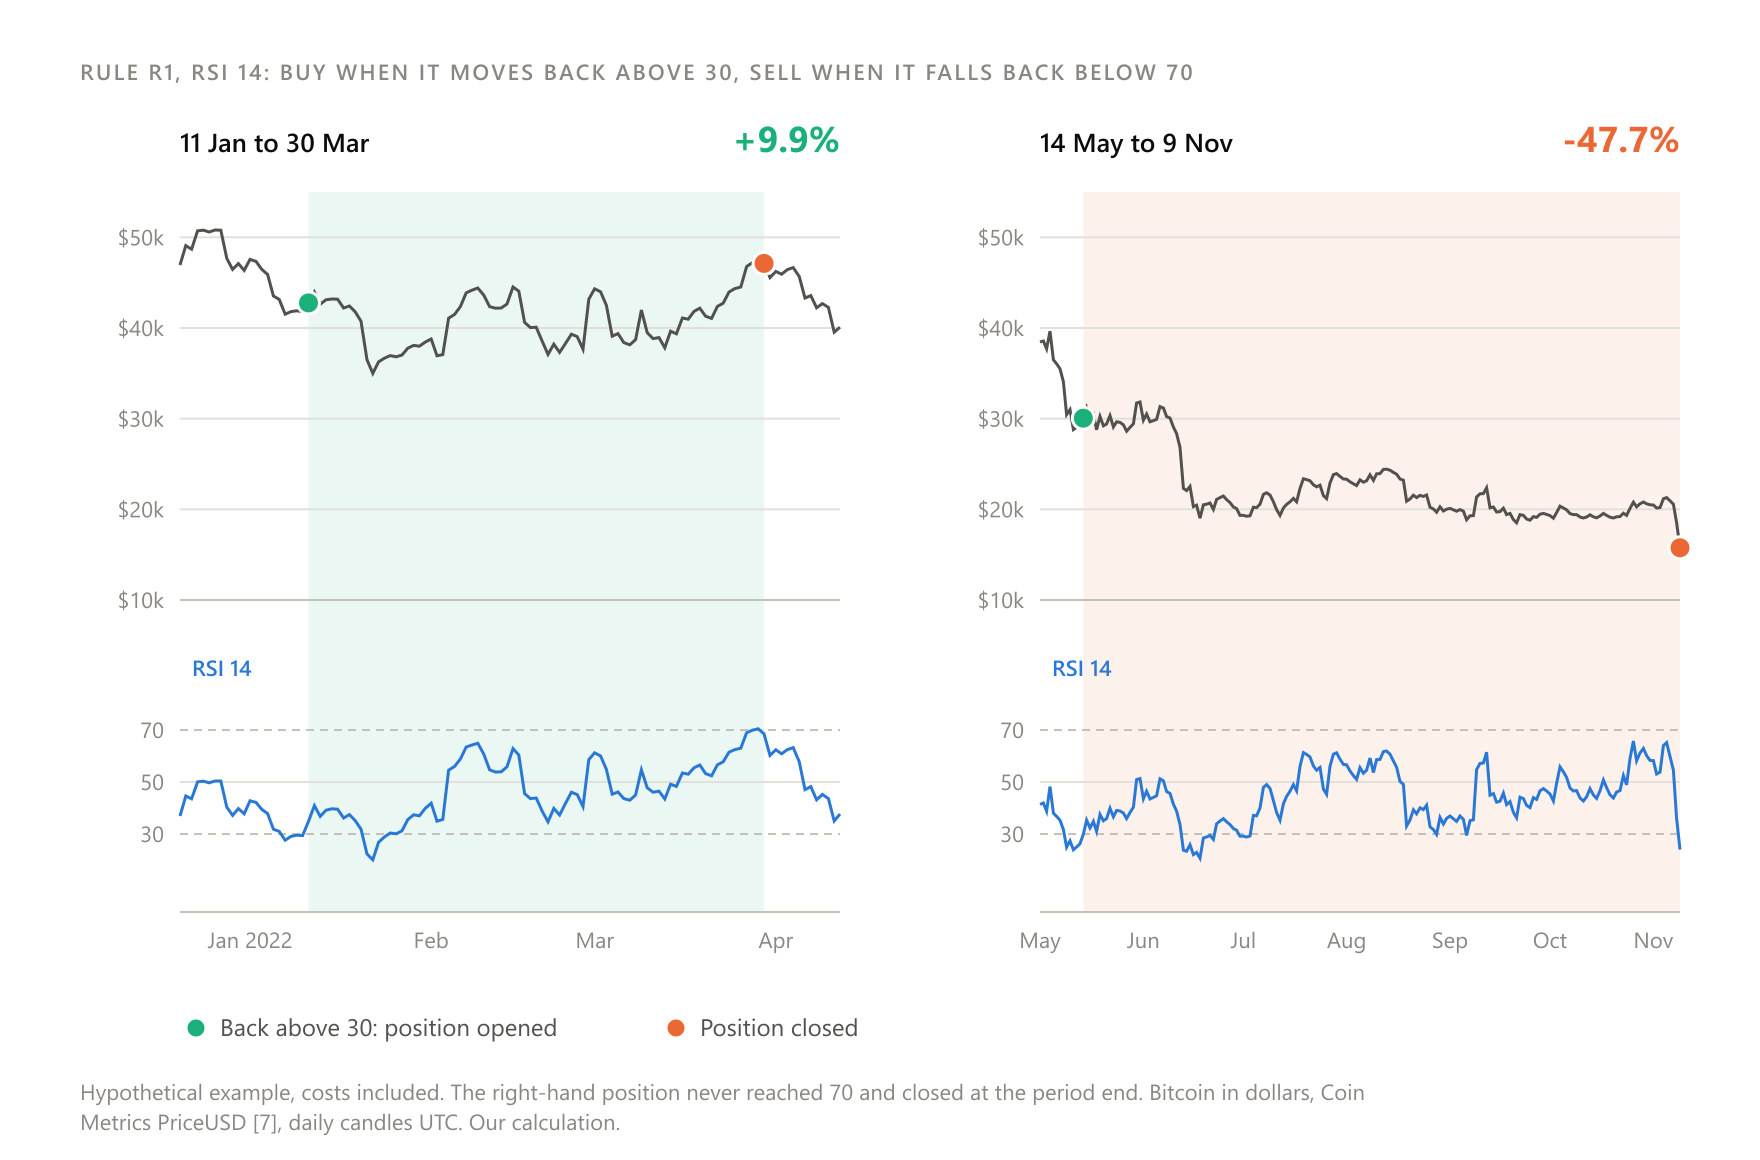
Hypothetical example where the reading matched the move: on 11 January 2022 the RSI moved back above 30, with a price of 42,768 dollars. On 30 March 2022 it fell back below 70, with a price of 47,123. The result was +9.9%.
Hypothetical example where the reading failed: on 14 May 2022 the indicator moved back above 30, with a price of 30,052. It never came near 70 again before 9 November 2022, when the price was 15,758. The result was -47.7%.
These results describe a past period and do not show what will happen in the future.
Divergences (Wilder)
Wilder considered divergence between the indicator and the price a strong sign that a turning point is near [2][11]. A bearish divergence occurs when price makes a new high but the RSI makes a lower one, and a bullish divergence when price makes a new low but the RSI makes a higher one [2].
Hypothetical example where the reading matched: a bullish divergence was confirmed on 18 March 2022, with a price of 41,826. By 30 March 2022 the price had reached 47,123, a gain of +12.3%.
Hypothetical example where it failed: a new bullish divergence was confirmed on 23 May 2022, with a price of 29,088. Sixty days later, on 22 July 2022, the price was 22,706, a loss of -22.2%.
These results describe a past period and do not show what will happen in the future.
The failure swing (Wilder)
Wilder considered failure swings a strong sign of reversal [2]. In the bearish version, the RSI rises above 70, pulls back, fails to exceed its previous peak, and then falls below the low of the pullback [2]. Fidelity also describes the bullish version: the RSI makes a higher low and then rises above its previous high [6] (platform source).
Hypothetical example where it matched: a bullish failure swing completed on 4 February 2022, with a price of 41,080. By 30 March 2022 the result was +14.4%.
Hypothetical example where it failed: the next one completed on 19 May 2022, with a price of 30,258. By 9 November 2022 the result was -48.1%.
These results describe a past period and do not show what will happen in the future.
The 50 line and trend ranges (later interpretations)
The 50 centreline is often treated as support and resistance for the indicator itself [2]. Andrew Cardwell observed that in uptrends the RSI usually moves between 40 and 80 [2][11]. For downtrends Wikipedia gives a range of 60 to 20 [2], while the 2023 study attributes a different range to Cardwell [11]. Cardwell also named "positive" and "negative reversals" patterns that, in his view, confirm the trend will continue [2].
Fidelity gives different ranges: 40 to 90 in uptrends, with 40 to 50 as support, and 10 to 60 in downtrends, with 50 to 60 as resistance [6] (platform source). The sources disagree on the limits, and none presents a test. The patterns called "hidden divergence" online resemble Cardwell's reversals. Matching the two is our own reading.
Hypothetical example: the rule "hold a position while the 14-day RSI closes above 50" returned +366.5% in the rising period from 1 October 2020 to 13 April 2021. In the falling period from 8 November 2021 to 9 November 2022, 14 of its 16 trades lost money (average gain +3.1%, average loss -5.0%). These results describe a past period and do not show what will happen in the future.
Why the value can stay above 70 for weeks
An indicator bounded by 0 and 100 looks as though it "must" return to the middle. But the RSI does not measure how expensive a price is. It measures only whether rises have dominated recently. As long as the rises continue, the indicator stays high.
From 1 January 2013 to 23 May 2026 (4,891 days), Bitcoin's 14-day RSI (Coin Metrics PriceUSD, daily candles UTC) was above 70 on 14.0% of days and below 30 on 3.7% (our calculation). The longest unbroken stretch above 70 lasted 90 days, from 10 January to 9 April 2013. Over that stretch the reference price rose from 14.12 to 230.68 dollars (our calculation).
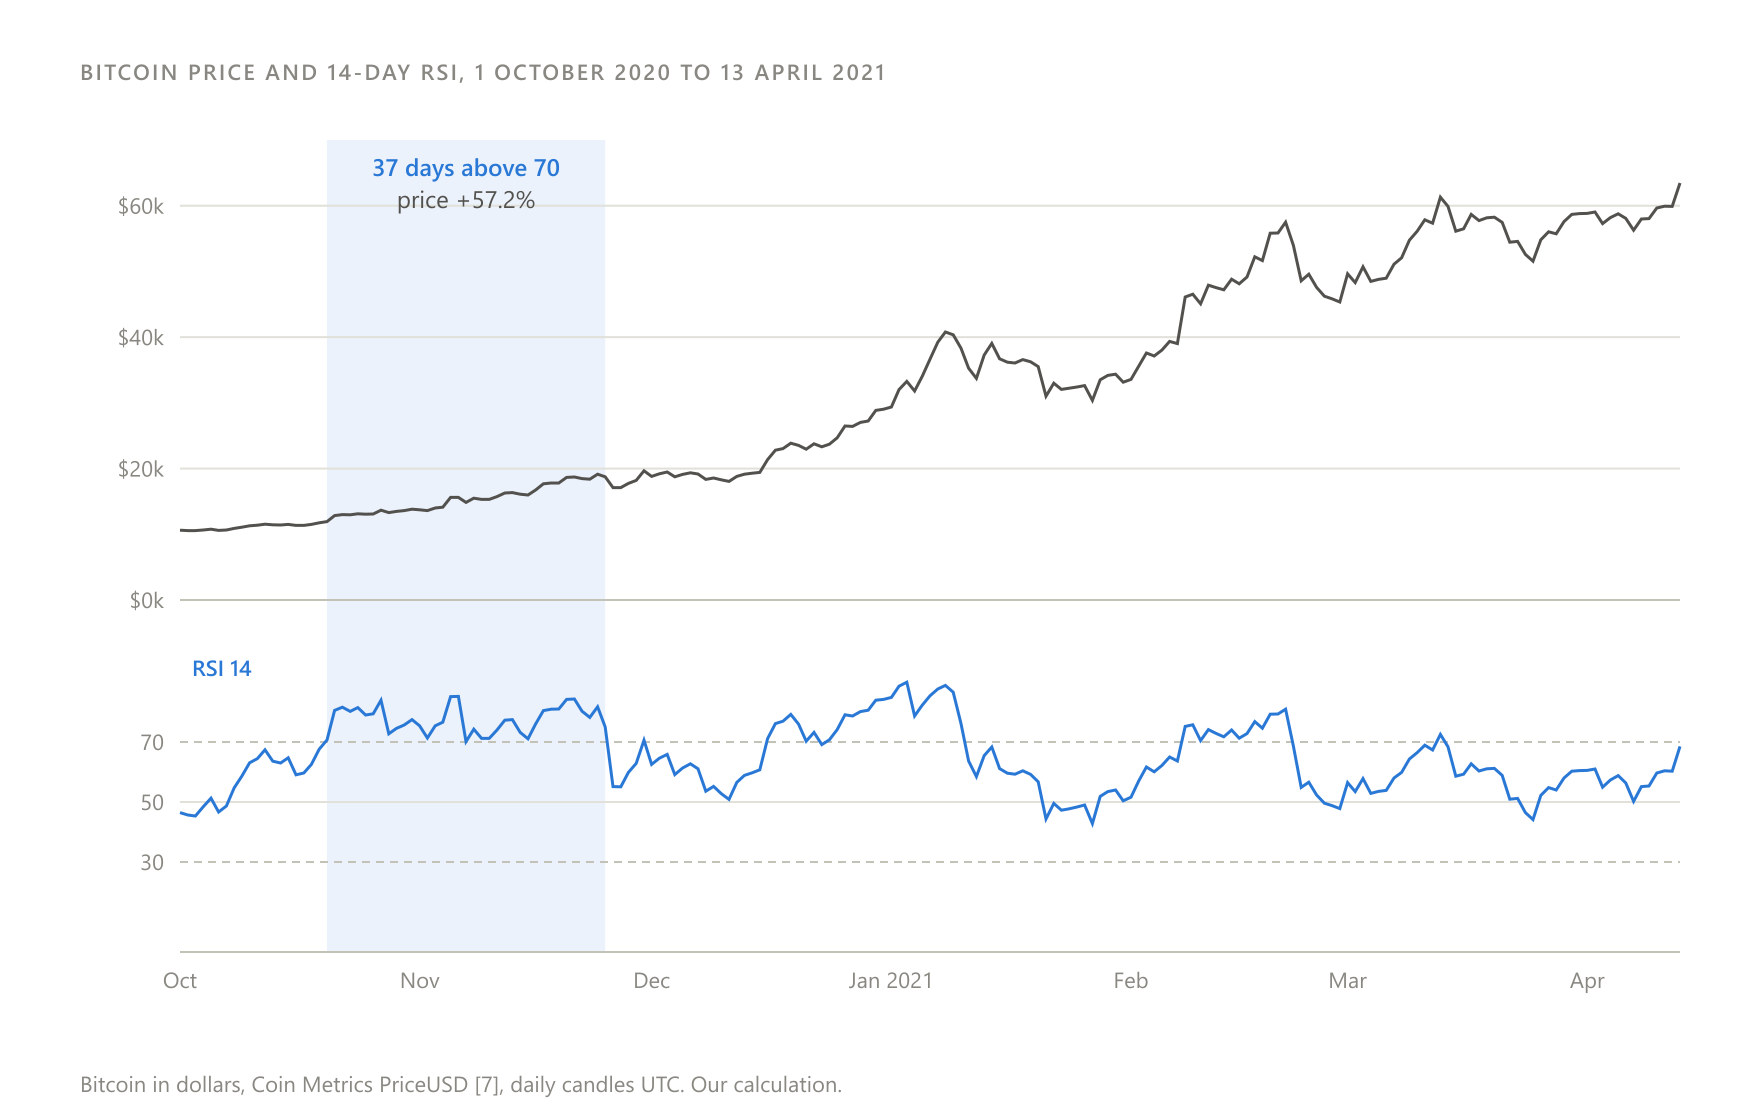
In the rising period of 2020 and 2021 the indicator was above 70 on 40.0% of days, with a longest unbroken stretch of 37 days, from 20 October to 25 November 2020. Over those 37 days the price rose 57.2% (our calculation).
Hypothetical example of what followed: from 2013 to 2026 we counted 103 times the 14-day RSI crossed above 70. Thirty days later, the median price change was +10.0% and 64.1% of cases were positive. For comparison, across all days in the period the median thirty-day change was +2.9%, with 56.0% positive. After 64 crossings below 30, the median change was +1.2%, with 53.1% positive (our calculation, overlapping windows, no costs). These results describe a past period and do not show what will happen in the future.
Divergence in a form that can be tested
To test a divergence, it first has to be defined with no room for interpretation. We defined a trough as a closing price lower than the five before it and the five after it. The trough is therefore confirmed five days later, once it is known.
A bullish divergence exists when two consecutive troughs are 5 to 60 days apart, the second is lower in price but higher in RSI, and the RSI at the second trough is below 50. The position is closed when the indicator falls back below 70 or after 60 days. The definition is based on the method of a published study, which used a distance of 3 to 60 candles [11].
With this definition, in the hypothetical example the 2020 and 2021 rising period produced no divergences. The falling period produced three, the sideways period one, and the later period three. The detailed results are in the tables in "What the evidence shows".
The same reading in a trend and in a sideways market
In the rising period from 1 October 2020 to 13 April 2021, the 14-day RSI never fell below 30. The 30 and 70 rule made no trades at all, while the price almost sixfolded.
In the sideways market (a market with no clear direction) from 14 March to 14 October 2024, the same rule made one profitable trade (+6.7%). The 50 rule lost on 11 of 16 trades (average gain +3.0%, average loss -4.5%), because the price kept crossing above and below the line (hypothetical examples, our calculation). These results describe a past period and do not show what will happen in the future.
The variants and relatives
| Version (hypothetical example) | What changes | RSI for 18 June 2022 (our calculation) |
|---|---|---|
| Wilder's RSI, 14 periods | Smoothing with a factor of 1/14 | 20.67 |
| Cutler's RSI, 14 periods | Simple 14-day sums | 14.23 |
| RSI with an exponential average, 14 periods | Factor of 2/15 | 12.68 |
Cutler argued that the value of Wilder's RSI depends on where the data file starts, while his own version gives the same result whatever the starting point [2]. Aspen Graphics' documentation for Cutler's RSI simply adds up the rises and falls over the period [12] (platform source).
The same documentation describes Wilder's RSI as the difference between the open and the close of the same candle [12]. Wikipedia describes the difference between consecutive closes [2], and the book's own terms ("previous close", "average UP close") point the same way [5]. In addition, TA-Lib, with closing prices as its only input, returned exactly the same results as our own close-to-close calculation. Only the book's original text can settle the question for good.
Compared with other indicators, the RSI is not the only way to measure momentum. The studies we examined tested it alongside the MACD [13][11] and alongside trend-following indicators such as the 200-day moving average [11]. Choosing between them is a choice between speed and noise, not between a right and a wrong tool.
What the evidence shows
Research on traditional markets
The findings in this subsection concern stocks and stock indices, not cryptocurrencies, and do not transfer automatically.
| Study | Market and period | Finding |
|---|---|---|
| Chong and Ng, 2008 | London FT30 index, 60 years of data | RSI and MACD rules produced returns higher than buy-and-hold in most cases [13] |
| Chong, Ng and Liew, 2014 | Stock indices of five other OECD countries | The RSI(21,50) rule produced significant excess returns in Milan and Toronto, and the RSI(14, 30/70) rule was profitable on the Dow Jones [14] |
| Park and Irwin, 2004 | Review of 92 modern studies | 58 positive, 24 negative and 10 mixed, with most showing problems of method such as data snooping, rules chosen after the fact and difficulty estimating risk and costs [15] |
Research on cryptocurrencies
The study by Zatwarnicki, Zatwarnicki and Stolarski (2023) examined the RSI on 10 cryptocurrencies and an index of the whole market. It used daily data from 1 January 2018 to 1 January 2022, a fee of 0.1% per trade, and did not include slippage [11]. Its main findings:
Buying in the oversold zone: portfolio +177.7% against +275.22% for buy-and-hold. The versions that opened short positions lost all their capital. For the coins that rose, returns after the overbought zone were more often above average than after the oversold zone. Divergences appeared on about 0.8% of candles, and a buy-only divergence strategy returned +86.15%, about 32% of buy-and-hold.
The rule "hold a position while the RSI is above 50" produced, in the authors' words, above-average results for 9 of the 10 coins in 2018 to 2021. In 2022 it returned -41.40% against -65.75% for the portfolio. The authors found this rule after an exhaustive search of many versions, which raises the risk of overfitting (fitting a rule too closely to the past). They also calculated the RSI with only 14 days of data before the start of the period. By our warm-up table, that leaves about 35% weight on the starting value in the first readings.
Gerritsen and colleagues (2020) tested seven trend indicators on Bitcoin, with daily data from July 2010 to January 2019. They found the strongest results mainly for the trading range breakout rule, measuring outperformance with the Sharpe ratio [16].
Hudson and Urquhart (2021) examined 14,919 rules from five classes, including a class of oscillators that look for overbought and oversold zones, with data up to 31 December 2017. They found significant predictability even after corrections for data snooping. However, only a small share of the rules beat buy-and-hold on annualised return, and for Bitcoin the rules gave no positive returns out of sample, in the first half of 2018 [17].
Our own tests
A backtest (a historical test of rules) applies a rule mechanically to old data. Everything below is a hypothetical example.
The data is Bitcoin in dollars, Coin Metrics PriceUSD, daily candles closing at the end of the day UTC [7][8]. The RSI was calculated with full history from July 2010, so the warm-up does not affect the results.
Each rule invests all its capital, buys only, uses no leverage and opens no short positions. Execution happens at the closing price of the signal day. In a market that never closes, that price is equivalent to the next day's open. We charged a trading fee of 0.10% and slippage (the gap between the expected and the actual execution price) of 0.05% every time a position was opened or closed. The fee is the level cited in the 2023 study [11]. The slippage is our own assumption. Each period starts with no position. Positions still open at the end are closed at the last price, with costs.
There are four rules. R1 opens a position when the RSI moves back above 30 and closes it when the RSI falls back below 70. R2 holds a position while the RSI closes above 50. R3 opens a position on a bullish divergence as defined above.
R4 opens a position on a bullish failure swing, as we defined it for the test: the RSI falls below 30, rises, pulls back by more than 3 points without falling below 30 again, and closes above its previous peak. The sequence resets if the indicator exceeds 70 before the signal. R3 and R4 close the position the same way R1 does (R3 also after 60 days).
We tested R1 and R2 with periods of 7, 14 and 21, and R3 and R4 with 14 only. That makes 8 versions in total, all defined before the runs, and we show every one. We tested no others. The last period was not used to choose any setting.
The first three periods were defined by highs and lows that are known only in hindsight. The falling period starts exactly at the top. That is unfair to buy-and-hold and favours every rule that starts without a position.
The drawdown column shows the largest fall in capital from its highest point. The gain and loss percentages are averages per trade, after costs.
Rising period, 1 October 2020 to 13 April 2021
| Rule | Trades | Winning | Average gain | Average loss | Total return | Maximum drawdown | Time in market |
|---|---|---|---|---|---|---|---|
| Buy-and-hold | 1 | +496.4% | -25.5% | 100% | |||
| R1, RSI 7 | 2 | 100% | +13.8% | none | +29.5% | -8.1% | 16.4% |
| R1, RSI 14 | 0 | 0.0% | 0.0% | 0% | |||
| R1, RSI 21 | 0 | 0.0% | 0.0% | 0% | |||
| R2, RSI 7 | 12 | 58.3% | +28.9% | -3.2% | +327.7% | -22.8% | 81.0% |
| R2, RSI 14 | 5 | 80.0% | +60.6% | -1.9% | +366.5% | -24.9% | 90.8% |
| R2, RSI 21 | 4 | 75.0% | +82.1% | -1.9% | +381.8% | -26.6% | 95.9% |
| R3, RSI 14 | 0 | 0.0% | 0.0% | 0% | |||
| R4, RSI 14 | 0 | 0.0% | 0.0% | 0% |
These results describe a past period and do not show what will happen in the future.
Falling period, 8 November 2021 to 9 November 2022
| Rule | Trades | Winning | Average gain | Average loss | Total return | Maximum drawdown | Time in market |
|---|---|---|---|---|---|---|---|
| Buy-and-hold | 1 | -76.7% | -76.7% | 100% | |||
| R1, RSI 7 | 5 | 40.0% | +9.5% | -27.8% | -59.1% | -64.2% | 65.7% |
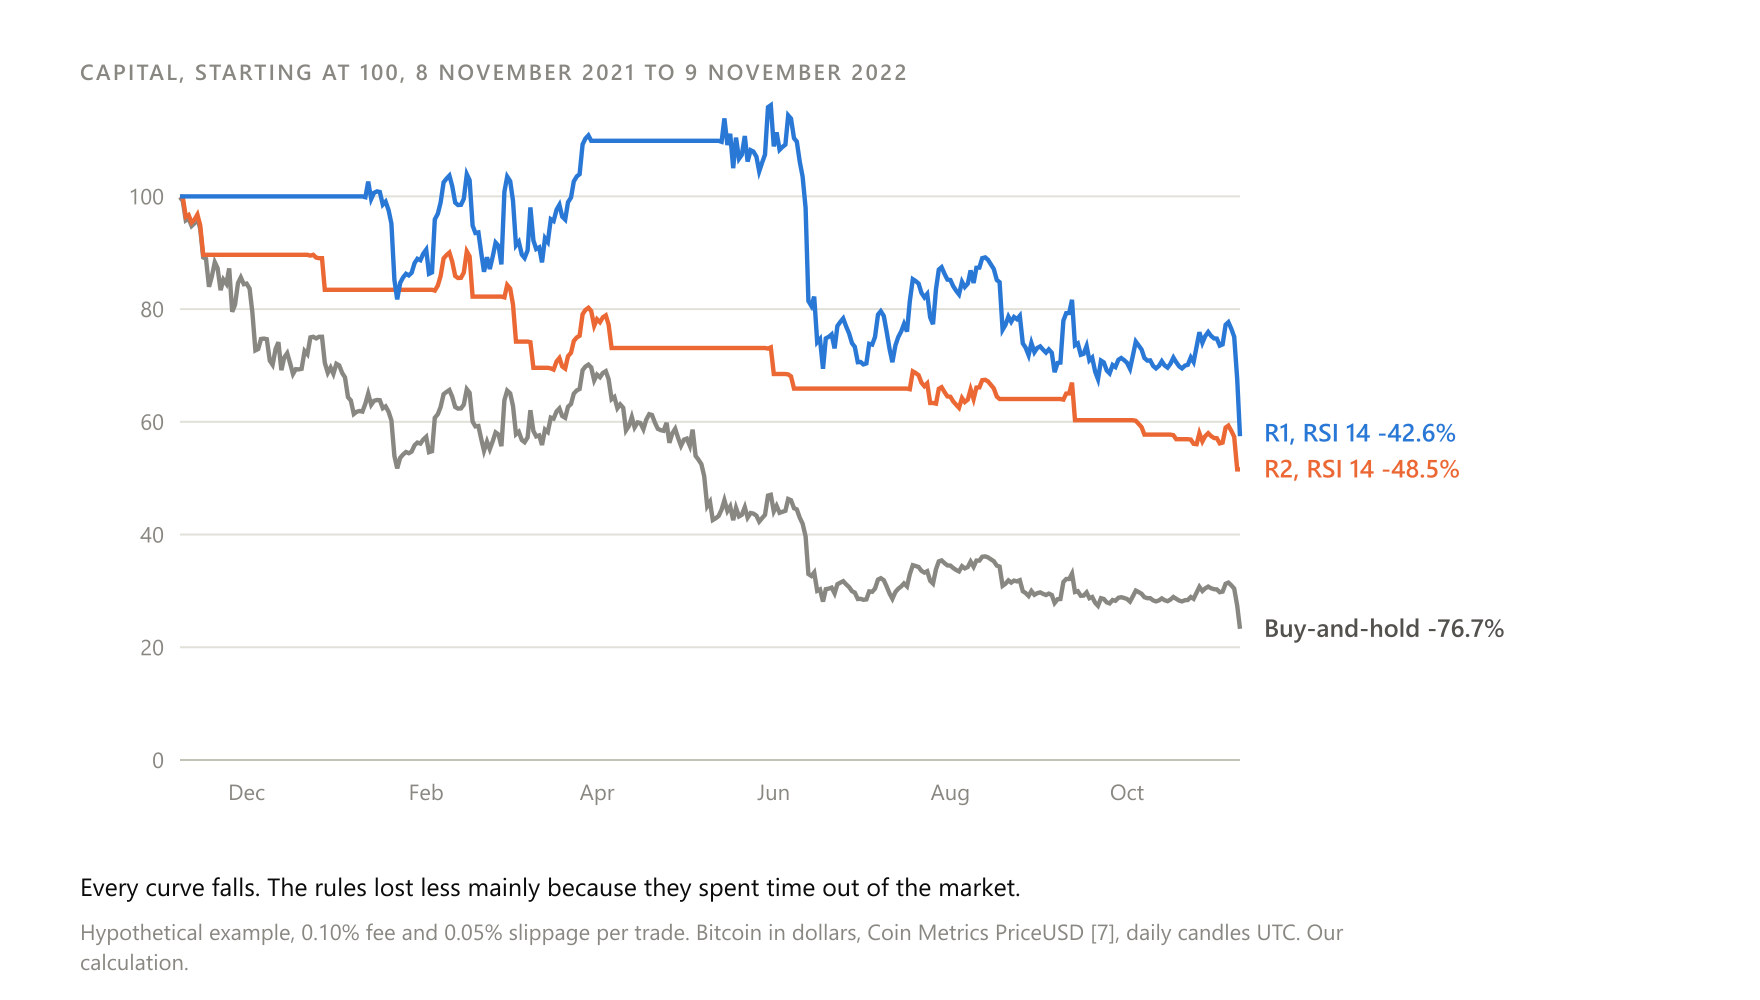
| R1, RSI 14 | 2 | 50.0% | +9.9% | -47.7% | -42.6% | -50.6% | 70.3% |
| R1, RSI 21 | 1 | 0% | none | -56.7% | -56.7% | -66.8% | 79.3% |
| R2, RSI 7 | 23 | 21.7% | +2.6% | -4.0% | -45.5% | -45.5% | 33.5% |
| R2, RSI 14 | 16 | 12.5% | +3.1% | -5.0% | -48.5% | -48.5% | 28.9% |
| R2, RSI 21 | 12 | 8.3% | +2.4% | -5.3% | -44.2% | -44.2% | 25.3% |
| R3, RSI 14 | 3 | 33.3% | +12.3% | -20.2% | -28.5% | -41.7% | 31.9% |
| R4, RSI 14 | 2 | 50.0% | +14.4% | -48.1% | -40.6% | -50.6% | 62.4% |
These results describe a past period and do not show what will happen in the future.
Sideways period, 14 March to 14 October 2024 (price change of -7.6% from start to end; highest close 33.2% above the lowest)
| Rule | Trades | Winning | Average gain | Average loss | Total return | Maximum drawdown | Time in market |
|---|---|---|---|---|---|---|---|
| Buy-and-hold | 1 | -7.9% | -24.9% | 100% | |||
| R1, RSI 7 | 4 | 100% | +5.4% | none | +23.5% | -13.1% | 43.3% |
| R1, RSI 14 | 1 | 100% | +6.7% | none | +6.7% | -21.0% | 52.1% |
| R1, RSI 21 | 0 | 0.0% | 0.0% | 0% | |||
| R2, RSI 7 | 23 | 21.7% | +4.2% | -3.1% | -30.1% | -36.9% | 48.8% |
| R2, RSI 14 | 16 | 31.2% | +3.0% | -4.5% | -31.0% | -34.7% | 48.4% |
| R2, RSI 21 | 10 | 30.0% | +2.5% | -4.6% | -22.5% | -28.9% | 49.3% |
| R3, RSI 14 | 1 | 0% | none | -0.6% | -0.6% | -21.0% | 27.9% |
| R4, RSI 14 | 1 | 100% | +5.0% | none | +5.0% | -21.0% | 49.8% |
These results describe a past period and do not show what will happen in the future.
Out-of-sample period, 1 January 2025 to 23 May 2026 (the last day available in the data archive)
| Rule | Trades | Winning | Average gain | Average loss | Total return | Maximum drawdown | Time in market |
|---|---|---|---|---|---|---|---|
| Buy-and-hold | 1 | -19.1% | -49.1% | 100% | |||
| R1, RSI 7 | 9 | 55.6% | +5.5% | -10.6% | -19.2% | -45.7% | 54.5% |
| R1, RSI 14 | 3 | 100% | +10.3% | none | +33.5% | -19.1% | 47.4% |
| R1, RSI 21 | 1 | 0% | none | -12.1% | -12.1% | -34.6% | 35.8% |
| R2, RSI 7 | 36 | 25.0% | +6.6% | -2.1% | -2.2% | -30.2% | 48.6% |
| R2, RSI 14 | 23 | 21.7% | +8.1% | -2.4% | -6.4% | -25.9% | 47.8% |
| R2, RSI 21 | 19 | 21.1% | +8.3% | -1.9% | +1.7% | -20.4% | 45.5% |
| R3, RSI 14 | 3 | 66.7% | +12.4% | -12.9% | +9.9% | -25.5% | 28.1% |
| R4, RSI 14 | 3 | 100% | +11.5% | none | +38.2% | -12.7% | 37.2% |
These results describe a past period and do not show what will happen in the future.
How should these tables be read? First, the trade counts are small. A 100% share of winning trades over three trades, or one, says almost nothing about the future.
Second, the same setting behaved differently from period to period. R1 with RSI 14 made no trades during the big rise and held a position through the whole 2022 decline. R2 followed the rise, but lost on 14 of 16 trades in the decline (average gain +3.1%, average loss -5.0%) and returned -31.0% in the sideways market.
Third, in the falling period every rule lost less than buy-and-hold. That is mainly due to time out of the market and to the period starting at the top. It is not due to any predictive ability. These results describe a past period and do not show what will happen in the future.
What the evidence cannot show
None of the tests shows whether a rule will keep behaving the same way. The periods are few and the trades are sparse. The reference price is not a price that can be executed exactly on any exchange, and it can be revised in limited windows [9]. The studies on stocks cover other decades and other markets.
What the indicator trades away
All smoothing brings lag: the indicator reacts to changes a little later than the price. A shorter period reduces lag but increases false signals, as the 36 trades of R2 with RSI 7 in the last period show (hypothetical example).
In a strong trend, the 70 and 30 zones stay active for weeks. In a sideways market, the 50 line is crossed constantly. The result depends heavily on the period, the timeframe, the closing time and the data source.
The RSI does not change values for candles that have already closed. The reading for the candle that is still open, however, keeps changing until it closes, because it uses the current price as the close. This resembles repainting (indicator readings that change after they first appear). A "signal" seen in the middle of the day may not exist at the close.
When the readings went wrong
21 June 2017, ETH-USD on GDAX. The head of GDAX explained that at 12:30 Pacific time (US) a market sell order worth several million dollars was placed on the ETH-USD market. It was filled from 317.81 down to 224.48 dollars, a slippage of 29.4%. That set off a cascade of about 800 stop-loss orders and forced liquidations, and ETH briefly traded at 0.10 dollars [18]. A stop-loss is an order that automatically closes a position at a preset price to limit the loss.
What it shows, in our reading: a daily RSI based on closes is barely affected by a wick like that (the thin line of a candle that shows its extreme price). A one-minute RSI on that exchange, however, would have shown extreme values unrelated to the rest of the market. Coin Metrics states that its reference rates resist outliers of this kind on a single market [9].
May to November 2022, Bitcoin (hypothetical example). On 14 May 2022, R1 with RSI 14 opened a position when the indicator moved back above 30. Up to 9 November 2022 the indicator did not approach 70, and the position closed at the end of the period at -47.7%. The bullish failure swing of 19 May 2022 ended at -48.1% over the same stretch. These results describe a past period and do not show what will happen in the future. What it shows: in a prolonged decline, leaving the oversold zone can be no more than a pause before a further fall.
2018 to 2021, ten cryptocurrencies (published study). The strategies that opened short positions in the overbought zone lost all their capital [11]. What it shows: in a market that rose several times over, the reading "above 70 means a fall" was as costly as it could be.
Common misconceptions
"Above 70 means the price will fall." In Bitcoin data from 2013 to 2026 the opposite was often the case. Thirty days after a crossing above 70, the median change was +10.0%, against +2.9% for all days (hypothetical example, our calculation). These results describe a past period and do not show what will happen in the future. Fidelity also notes that in strong trends the indicator can stay at extreme values for long periods [6].
"Below 30 is an opportunity." In the 2022 decline, the first move back above 30 in May was followed by a further fall of almost 48% (hypothetical example). These results describe a past period and do not show what will happen in the future.
"The RSI compares a coin with the market." No. As noted above, it compares the price only with its own recent past [2].
"The RSI has one value." For the same day, the versions we calculated ranged from 11.92 to 25.63, depending on the period and the smoothing method. Even the same formula gives 14.85 or 20.67 depending on how much history is used (our calculation).
The open questions
The first concerns data snooping (testing many rules until one "fits"). Park and Irwin recorded more positive studies than negative ones. But they observed that most had problems of method, and that research must fix them before it can give conclusive answers [15]. The rule that stood out in the 2023 crypto study was found after an exhaustive search [11].
The second concerns durability. Wilder himself argued that most trading systems work for a year or two, before markets adapt to them [1]. In the 2023 study, the ranking of the rules changed between the 2018 to 2021 period and 2022 [11]. In the 2021 study, the rules gave no positive returns for Bitcoin out of sample [17]. In our own tests, no setting behaved consistently across all the periods.
The third concerns costs. The 2023 study did not include slippage [11]. On exchanges with low liquidity, or at turbulent moments, slippage can be far larger than the 0.05% we assumed. On GDAX in 2017, a single order was filled with 29.4% slippage [18].
Our view at CRYPTONEA 24 is that any claim about an "RSI strategy" deserves three questions: how many versions were tested, how many trades support the result, and whether all costs were included.
The risks for the reader
The biggest risk is reading the RSI as a forecast. The indicator describes what happened over the last few days and nothing more. In our data, thirty days after a crossing below 30, the price was higher in 53.1% of cases, less often than on any day taken at random (56.0%) (hypothetical example, our calculation). These results describe a past period and do not show what will happen in the future.
A second risk is trusting a number without knowing how it was calculated. Period, smoothing, closing time and price source all change the reading.
A third is cost. Rules that change position often pay fees and slippage every time. In our tests, R2 with RSI 7 made 36 trades in about 17 months (hypothetical example). These results describe a past period and do not show what will happen in the future.
The most serious risk concerns leverage and short positions. In the 2023 study, the versions with short positions lost all their capital [11]. With leverage, a move against the position can trigger a forced liquidation before the indicator gives any new reading. On GDAX in 2017, about 800 stop-loss orders and liquidations were executed in a single cascade [18]. Finally, the rules governing crypto markets can change.
Where to go next
The RSI is easier to understand alongside the tools it borrows ideas from. Moving averages explain smoothing. The MACD is another way of measuring momentum. The Average True Range, which Wilder himself introduced in the same book, measures volatility [5][1]. It is also worth reading about the difference between one exchange's price and a reference price.
Sources
- P: TradersLog (reprinted from Trader's Journal, 2007), Welles Wilder Interview, traderslog.com/welles-wilder-interview, September 2009
- S: Wikipedia, Relative strength index, en.wikipedia.org/wiki/Relative_strength_index, accessed October 2026
- S: Open Library, New concepts in technical trading systems, openlibrary.org/books/OL4745184M, accessed October 2026
- S: Wikipedia, J. Welles Wilder Jr., en.wikipedia.org/wiki/J._Welles_Wilder_Jr., accessed October 2026
- S: Google Books, New Concepts in Technical Trading Systems, books.google.com/books?id=WesJAQAAMAAJ, accessed October 2026
- S: Fidelity, Relative Strength Index (RSI), fidelity.com/learning-center/trading-investing/technical-analysis/technical-indicator-guide/RSI, accessed October 2026 (platform source)
- P: Coin Metrics, Price (PriceUSD), docs.coinmetrics.io/network-data/network-data-overview/market/price, accessed October 2026 (platform source)
- P: Coin Metrics, Free Coin Metrics data archives (btc.csv), github.com/coinmetrics/data, downloaded October 2026 (platform source)
- P: Coin Metrics, FAQs, docs.coinmetrics.io/service-and-support/faqs, accessed October 2026 (platform source)
- P: TA-Lib, Unstable Period, ta-lib.org/api/unstable-period, October 2026 (platform source)
- P: Zatwarnicki M., Zatwarnicki K., Stolarski P., Effectiveness of the Relative Strength Index Signals in Timing the Cryptocurrency Market, Sensors 23(3), doi.org/10.3390/s23031664, February 2023
- P: Aspen Research Group, CutlersRSI, aspenres.com/Documents/AspenGraphics4.0/CutlersRSI.htm, 2008 (platform source)
- P: Chong T., Ng W., Technical analysis and the London stock exchange: testing the MACD and RSI rules using the FT30, Applied Economics Letters 15(14), ideas.repec.org/a/taf/apeclt/v15y2008i14p1111-1114.html, 2008
- P: Chong T., Ng W., Liew V., Revisiting the Performance of MACD and RSI Oscillators, mpra.ub.uni-muenchen.de/54149, March 2014
- P: Park C., Irwin S., The Profitability of Technical Analysis: A Review, farmdoc.illinois.edu/publications/the-profitability-of-technical-analysis-a-review, October 2004
- P: Gerritsen D., Bouri E., Ramezanifar E., Roubaud D., The profitability of technical trading rules in the Bitcoin market, Finance Research Letters 34, doi.org/10.1016/j.frl.2019.08.011, May 2020
- P: Hudson R., Urquhart A., Technical trading and cryptocurrencies, Annals of Operations Research 297, doi.org/10.1007/s10479-019-03357-1, 2021
- S: Finance Magnates, Ethereum Flash Crash Causes ETH to Temporarily Trade as Low as $0.10, financemagnates.com/cryptocurrency/trading/ethereum-flash-crash-causes-eth-temporarily-trade-low-0-10, June 2017
This article is educational and for general information. It is not investment or financial advice, and it is not a signal to buy or sell. Technical indicators describe past prices and do not predict future ones. Trading crypto, especially with leverage, can lead to the loss of all the money invested. The facts in crypto move quickly, so verify them before you act on anything here.